EUR/USD:
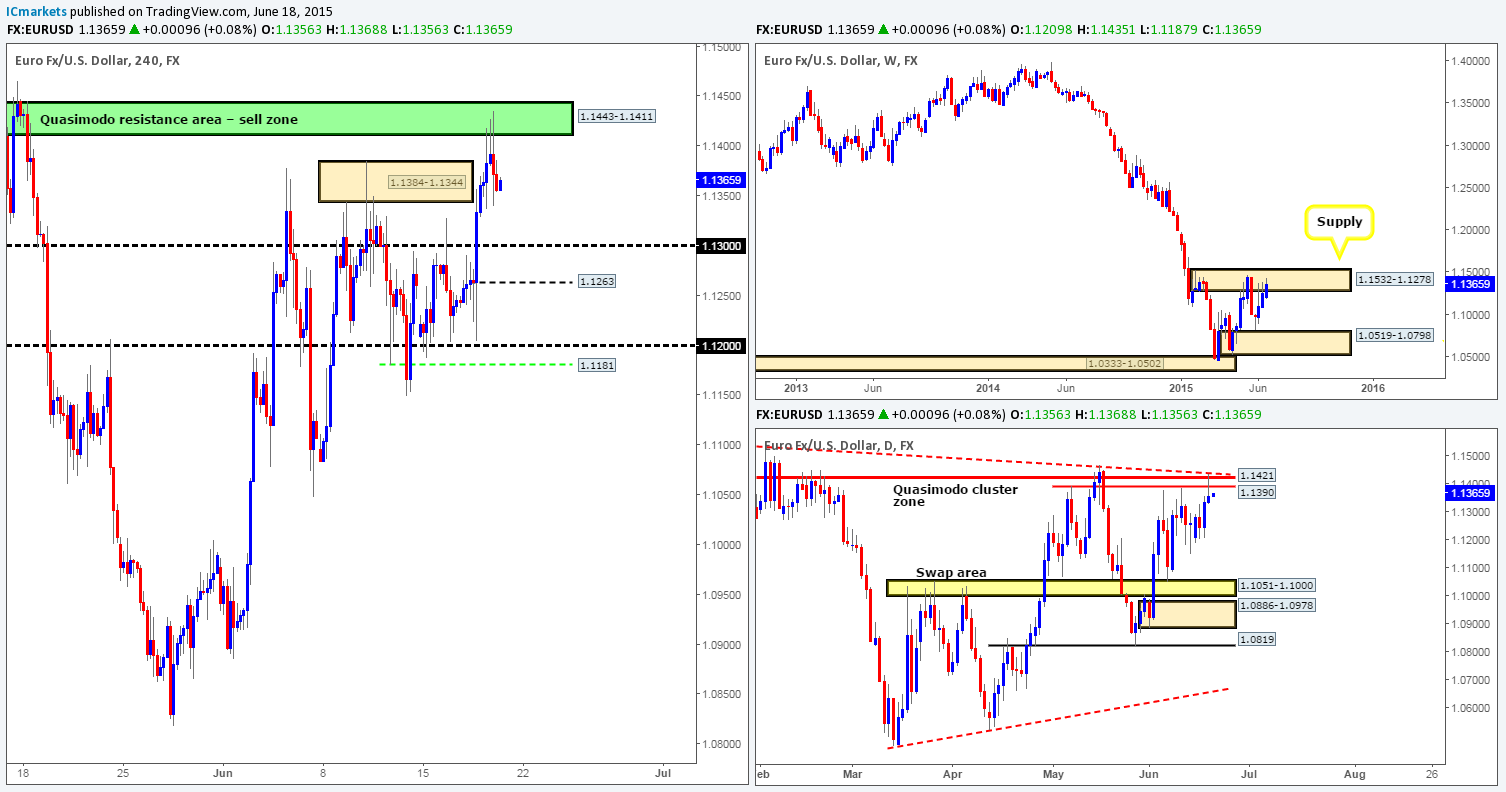
Weekly view: The weekly timeframe shows that price is currently trading within a weekly supply area coming in at 1.1532-1.1278.This supply zone is a very significant hurdle in our opinion (held price lower since the 11th May) since if there’s a sustained break above this area, our long-term bias (currently short) on this pair will very likely shift north.
Daily view: From this viewpoint, we can see that the Euro recently connected with a daily Quasimodo cluster zone at 1.1390/1.1421 (located relatively deep within the aforementioned weekly supply area), which, as you can see, also boasts trendline confluence from the high 1.1532.
4hr view: As a result of yesterday’s rally, price took out a 4hr Quasimodo resistance area at 1.1384-1.1344 with relative ease, resulting in price colliding with another 4hr Quasimodo resistance base seen in green at 1.1443-1.1411.
For those who read our previous analysis, you may recall us mentioning to keep a close eye on the both of the aforementioned 4hr Quasimodo areas for potential shorting opportunities. Unfortunately, we did not find any sell signals into this market at 1.1443-1.1411. Well done to those who did!
Ultimately, the market is in a fantastic position (see higher timeframes) to continue selling off today. Nonetheless, price may experience some supportive pressure from the recently broken 4hr Quasimodo base at 1.1384-1.1344 before doing so. This, in effect, could lead to a retest of the upper green 4hr Quasimodo area, thus potentially giving us a second chance to get short. In the event that no retest is seen, however, then the next objective to reach would likely be the 1.1300 region, or the 1.1263 level seen below it.
Therefore, to sum up, unless we see a retrace back up to the green 4hr Quasimodo base at 1.1443-1.1411, we’ll likely remain flat in this market until Monday.
Levels to watch/live orders:
- Buys: Flat (Stop loss: N/A).
- Sells: 1.1443-1.1411 [Tentative – confirmation required] (Stop loss: dependent on where one confirms this area, but would likely be around the 1.1469 mark).
GBP/USD:
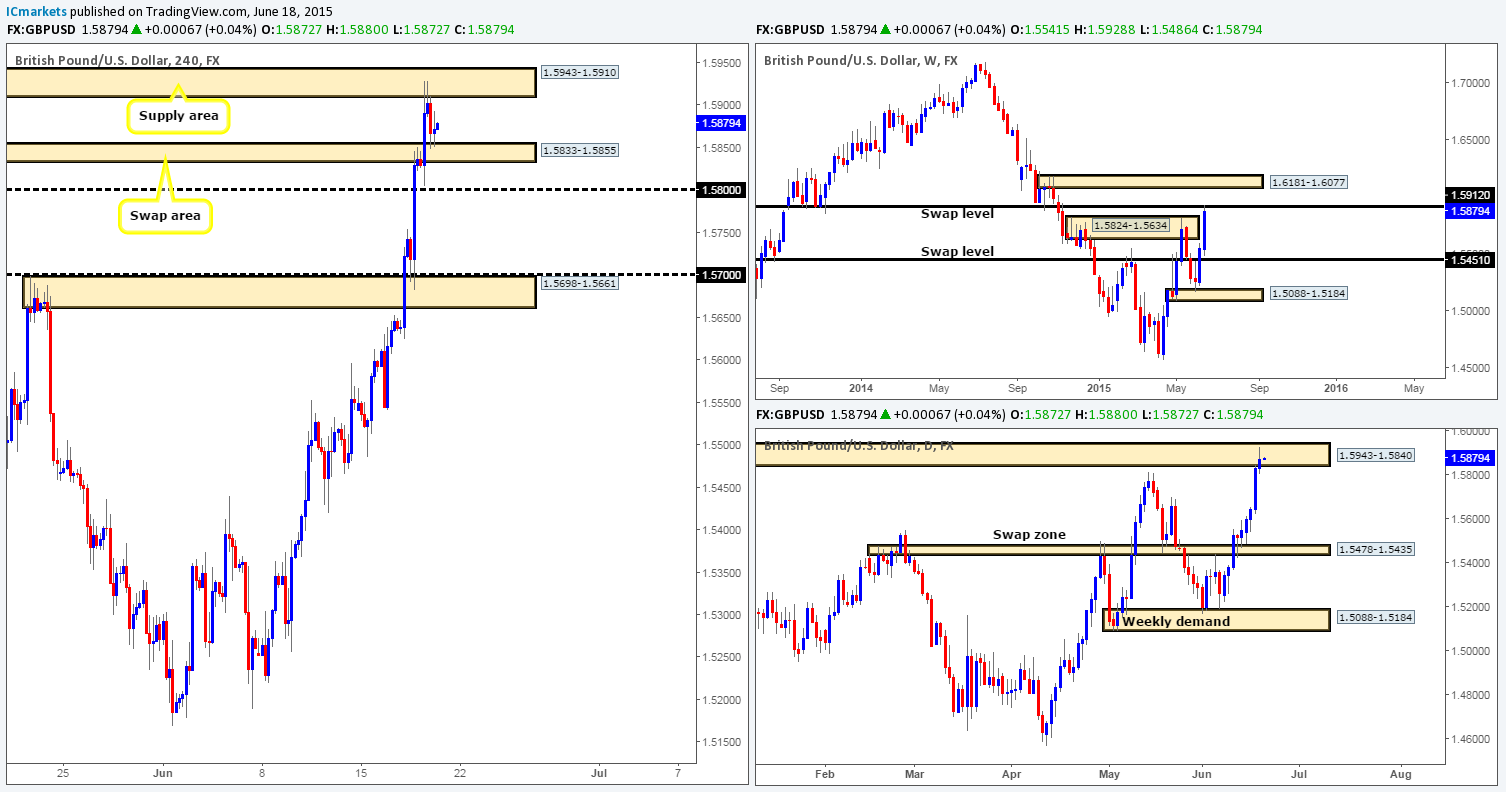
Weekly view – Following the recent break above weekly supply at 1.5824-1.5634, price has now clashed with a prominent weekly swap level coming in at 1.5912.
Daily view: The daily timeframe shows that the buyers and sellers are battling for position within a daily supply area at 1.5943-1.5840, which, if you look back to the weekly chart, you’ll see it encapsulates the aforementioned weekly swap level – Beautiful confluence!
4hr view: Yesterday’s action saw price consume the 4hr swap area at 1.5833-1.5855, and collide with a 4hr supply zone at 1.5943-1.5910 (located deep within the daily supply area mentioned above at 1.5943-1.5840). It should not come as much of a surprise here that price rebounded from this barrier since it is located in some pretty heavy-weight higher timeframe supply (see above). That said though the GBP is, as you can see, currently experiencing supportive pressure coming in from the recently broken 4hr swap area at 1.5833-1.5855, so there may be, if the GBP continues to be bought from here, a second chance to short (waiting for lower timeframe confirmation here is advised) this market around the 4hr supply zone at 1.5943-1.5910. In fact, under the present circumstances, we have little interest in trading this market anywhere else today other than here.
Levels to watch/ live orders:
- Buys: Flat (Stop loss: N/A).
- Sells: 1.5943-1.5910 [Tentative – confirmation required] (Stop loss: 1.5949).
AUD/USD:
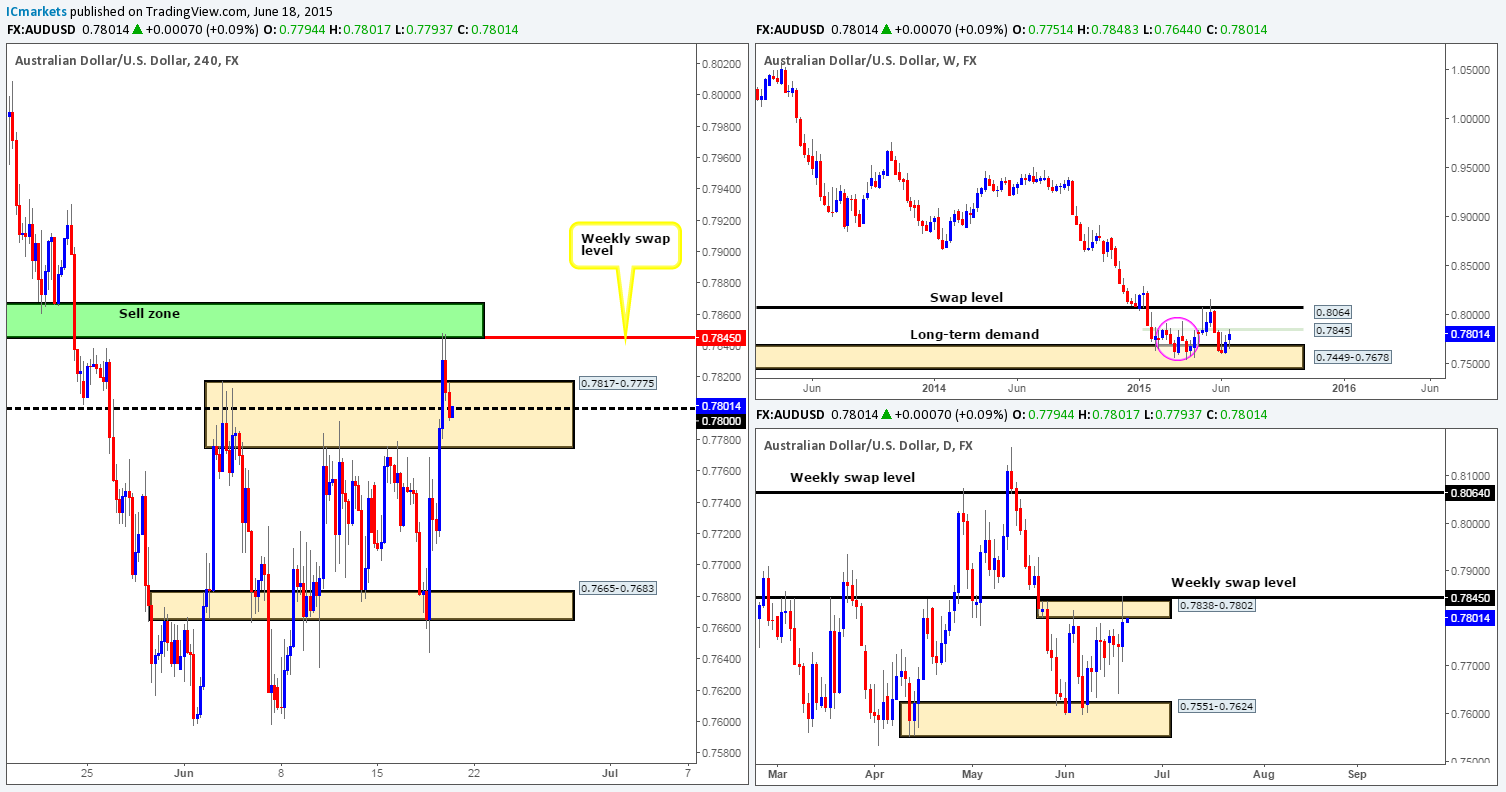
Weekly view – Following the rebound seen from the long-term weekly demand area at 0.7449-0.7678, price has shook hands with a minor weekly swap level coming in at 0.7845. However, judging by the sloppy reaction seen (pink circle – 02/02/15-06/04/15) between these two aforementioned weekly areas a few months earlier, things could potentially get messy here again before we see any decisive move take place. From a long-term perspective, nonetheless, the trend direction on this pair is still very much south in our opinion, and will remain this way until we see a convincing break above 0.8064
Daily view: From the pits of the daily scale, it appears that price has begun to chisel out a consolidation zone between a small daily supply area at 0.7838-0.7802, and a daily demand area coming in at 0.7551-0.7624. However, as you can see, price recently faked above the upper limits of this daily range to connect with the aforementioned minor weekly swap level.
4hr view: For anyone that read our previous report on the Aussie Dollar, you may recall us mentioning to be prepared for the possibility that price would likely breakout north from the 4hr range (0.7817-0.7775/ 0.7665-0.7683) and likely marry up with the 4hr sell zone in green at 0.7867/0.7845 (essentially the minor weekly swap level).
As you can see price did just that, which as a result filled our pending sell order set at 0.7842 (just below the aforementioned weekly swap level). The sell off from here was quite aggressive, driving price south back into the recently broken upper range limit (0.7817-0.7775) and taking out 0.7800. Ultimately, we would love to see the sellers hold the market below 0.7800 today, as this would give us confidence to set our stop at breakeven and maybe even leave the position open over the weekend. In the event that this does occur, we could potentially see this market drive back into the range giving us incredible reward to risk on this trade.
Levels to watch/ live orders:
- Buys: Flat (Stop loss: N/A).
- Sells: 0.7842 [Live] (Stop loss: 0.7875).
USD/JPY:
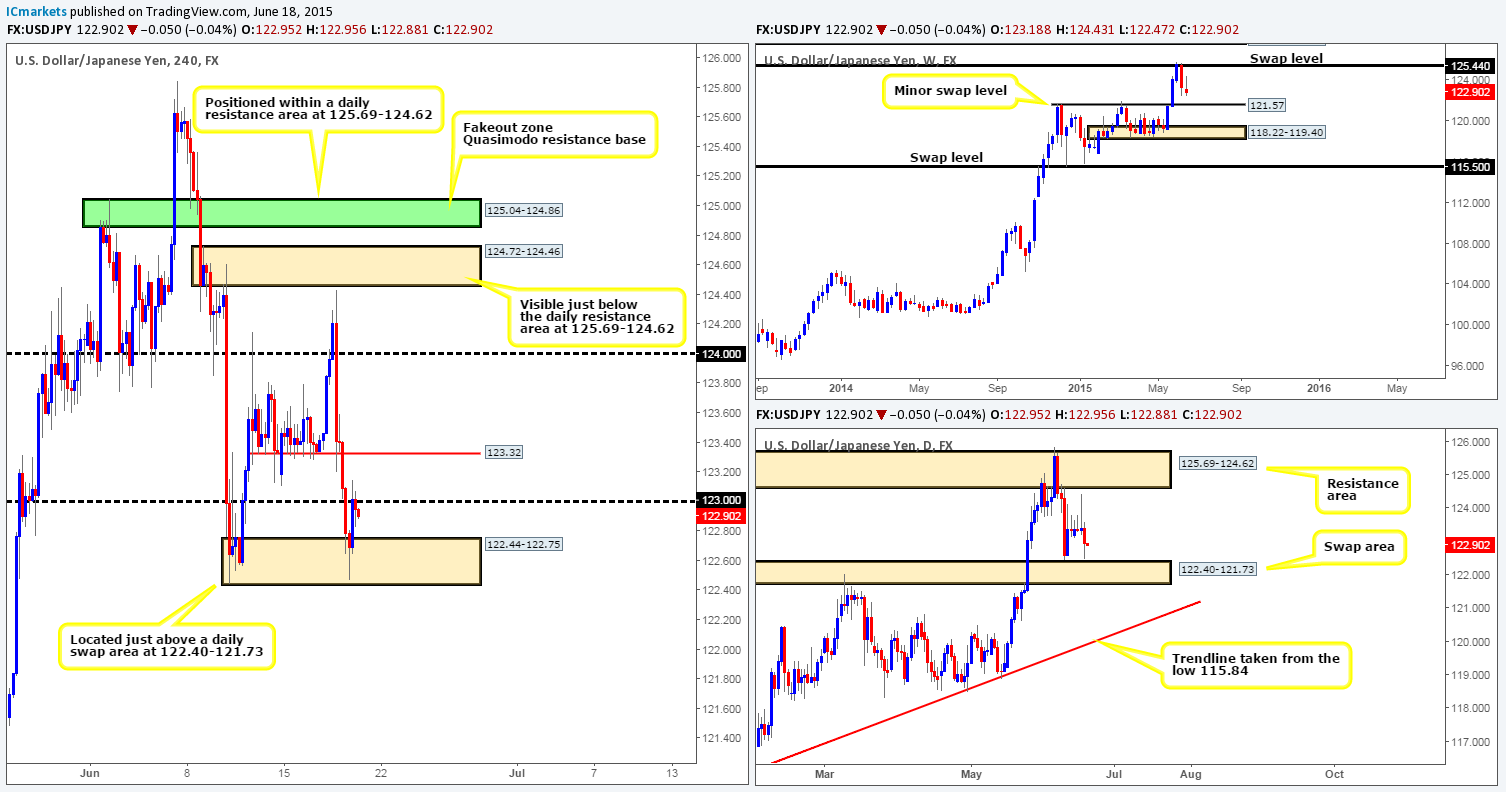
Weekly view – Last week’s activity saw the USD/JPY sell off from a weekly swap level at 125.44. On the assumption that the sellers can continue with this tempo today, we believe there’s a very good chance that price will greet the minor weekly swap level seen at 121.57. Despite this recent decline in value, however, the long-term uptrend on this pair is still very much intact, and will remain that way in our opinion until the weekly swap level 115.50 is consumed.
Daily view: The daily timeframe on the other hand, shows that price came very close to connecting with a daily swap area at 122.40-121.73, which is, effectively a key obstacle to a move towards the aforementioned minor weekly swap level.
4hr view: Throughout the course of yesterday’s sessions, price sold off, consequently taking out 123.00 and slamming into a 4hr demand area at 122.44-122.75 (located just above the aforementioned daily swap area). Our team did manage to spot a buy entry on the 15 minute timeframe around the 122.64 mark, but with us already short on the AUD/USD, we gave this trade a miss. And in all honesty, the AUD/USD trade was far better looking!
Going into to today’s sessions, there is not really much to go on as far as we can see. Even if price breaks above 123.00, the next objective to reach from here is only a mere thirty pips (123.32). Quite frankly, the only thing that would grab our attention today would be a push below the aforementioned 4hr demand area, as this will force price to collide with the daily swap zone at 122.40-121.73 and potentially give us an opportunity to buy.
Levels to watch/ live orders:
- Buys: Flat (Stop loss: N/A).
- Sells: Flat (Stop loss: N/A).
USD/CAD:
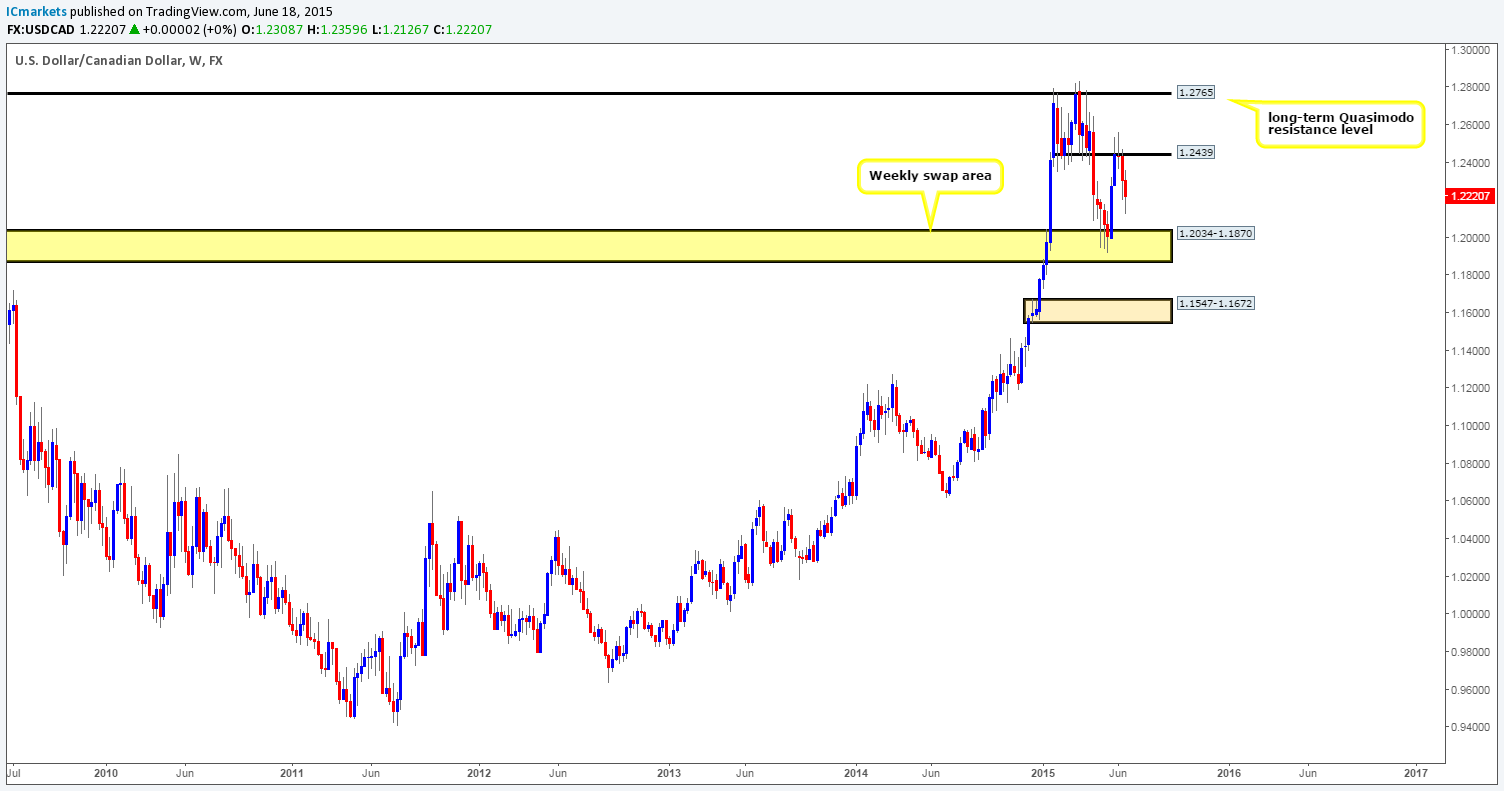
Weekly view – During last week’s trading, price sold off from a weekly swap level coming in at 1.2439. Provided that the sellers can continue with this tempo, we feel that there is a good chance that price will connect with the weekly swap area seen in yellow at 1.2034-1.1870. Despite the fact that this market is now in the red so to speak, our long-term bias on this pair remains long, and it will only be once/if we see a break below the aforementioned weekly swap area would our present bias likely shift.
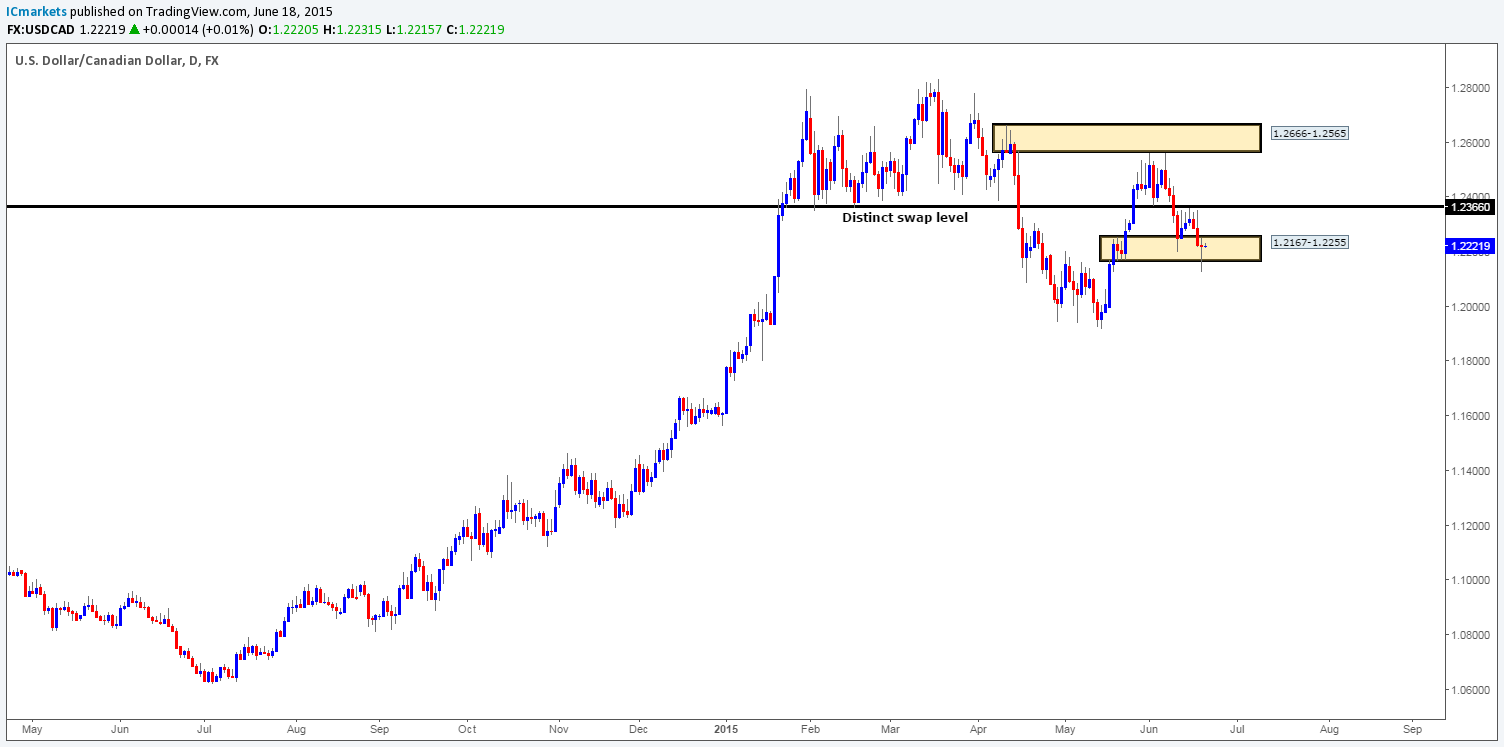
Daily view: The daily timeframe shows that price faked below a daily demand area at 1.2167-1.2255 during yesterday’s session. However, we’ll only be convinced that price is heading higher from here once/if we see a clean break above the near-term daily swap level seen at 1.2366.
USD/CHF:
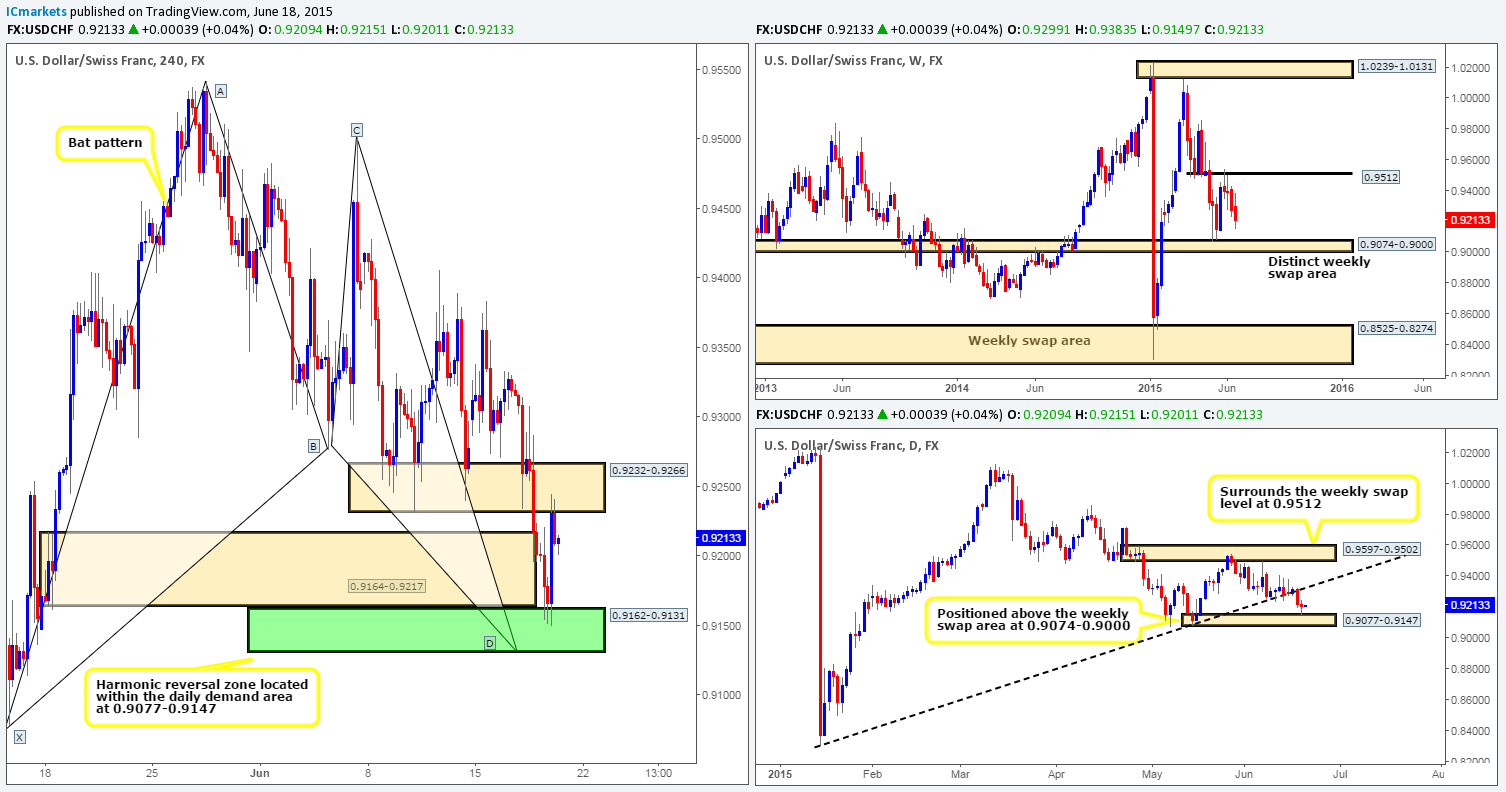
Weekly view – From the weekly timeframe, we can see that price continues to spiral south from the initial rebound at 0.9512. Should the sellers be able to continue with this intensity, it is likely we’ll see price shake hands with the weekly swap area seen below at 0.9074-0.9000 sometime soon.
Daily view: Following the close below the daily trendline taken from the low 0.8299, yesterday’s action saw price drive into a daily demand area seen at 0.9077-0.9147 (located just above the aforementioned weekly swap area).
4hr view: For those who read yesterday’s report on the USD/CHF, you may recall us mentioning to expect a fakeout below 4hr demand (0.9164-0.9217) into a 4hr Harmonic Bat reversal zone seen in green at 0.9162-0.9131 (located just within the aforementioned daily demand area), which as you can see did indeed take place. There was a nice confirmed long entry on the 15 minute timeframe around the 0.91561 mark within this 4hr Harmonic support zone, but we let it slide since we are already long the USD from our AUD/USD trade. For anyone who did enter long here, however, price should be sitting nicely in the green for you now. That said though, there is resistive pressure currently being seen from a clear 4hr swap area at 0.9232-0.9266, which could see price fall back to your entry level or worse. Therefore, if we were long now, 70% of our position would be liquidated and our stop set at breakeven. The reason we’d be hesitant leaving this position to run is simply because (even though the daily timeframe is showing demand) the weekly timeframe indicates there is still room for this market to decline (see above for levels), so trade carefully here guys.
Levels to watch/ live orders:
- Buys: Flat (Stop loss: N/A).
- Sells: Flat (Stop loss: N/A).
US 30:
Weekly view – As far as we can see, price is currently range bound at the moment between 18279 and 17556. From a longer-term perspective, however, the overall uptrend on this index is still very strong, and will remain this way in our opinion until we see a convincing push below 16051.
Daily view: Recent events on the daily timeframe shows price recently violated a daily supply area at 18168-18010. This move may have been enough to trigger stops above this zone and potentially open the gates for price to challenge the 18279 weekly level.
4hr view: The DOW’s recent advance took out several 4hr technical levels during the course of yesterday’s sessions, and only really saw any selling interest once price reached a high of 18178.
The selling form here has, as you can see, forced price to retest the 4hr resistance (now support) area at 18116-18088. If this zone holds going into today’s sessions, we could potentially see the DOW continue to rally. Our rationale behind this ides comes from the following:
- Room to move north on the weekly timeframe (see above).
- Recent violation of daily supply could induce further buying (see above).
- Above the 4hr supply area 18116-18088, we see very little active supply. Take note of the very obvious supply consumption wicks seen marked with blue arrows at: 18168/18188/18245/18274/18280/18313.
Therefore, given the points made above, the focal point today will be looking for lower timeframe buying confirmation around the 18116-18088 area. We have only one target in mind for this trade – the 18279 weekly level.
Levels to watch/ live orders:
- Buys: 18116-18088 [Tentative – confirmation required] (Stop loss: dependent on where one confirms this area).
- Sells: Flat (Stop loss: N/A).
XAU/USD (Gold)
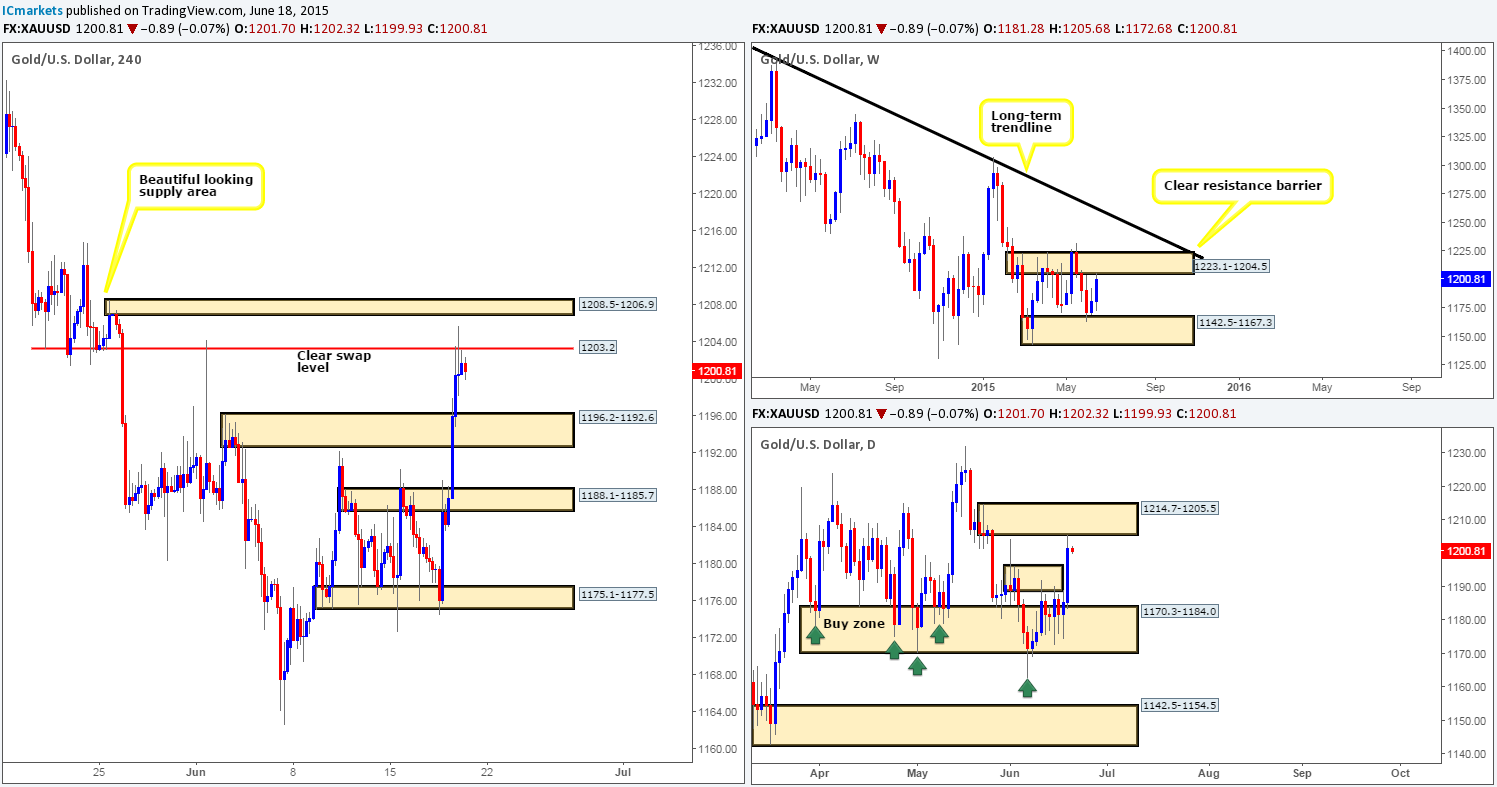
Weekly view – The weekly timeframe shows that gold has entered into a phase of consolidation between weekly demand at 1142.5-1167.3 and weekly supply at 1223.1-1204.5. From a long-term perspective, however, gold is still trending south in our opinion. It will only be once/if we see a close above the weekly trendline extended from the high 1488.0 would we begin to feel that this market may be reversing.
Daily view: From the daily timeframe, we can see that gold increased in value during the course of yesterday’s session. This move consequently took out the daily supply area at 1196.2-1188.9, and connected beautifully with another daily supply area just above at 1214.7-1205.5 (located within the aforementioned weekly supply area).
4hr view: Yesterday’s extension higher saw gold breach not only the 4hr supply area at 1188.1-1185.7, but also the 4hr supply area coming in at 1196.2-1192.6. It was only once price hooked up with the 4hr swap level at 1203.2 did we see any sort of selling pressure.
Considering the market’s overall position on the higher timeframes at the moment (see above), selling from the 1203.2 region is something our team has shown interest in. However, at the time of writing, we see very little confirming price action coming in from the lower timeframes here. Furthermore, there is a chance that price may fakeout above 1203.2 today and tie in with the small 4hr supply area seen at 1208.5-1206.9, so we need to be prepared for this. Should we manage to secure a short position between1203.2 and 1208.5-1206.9 sometime today, our first take-profit target will likely be set around the recently broken 4hr supply area (now demand) at 1196.2-1192.6.
Levels to watch/ live orders:
- Buys: Flat (Stop loss: N/A).
- Sells: 1203.2 [Tentative – confirmation required] (Stop loss: dependent on where one confirms this level).
