Waiting for lower timeframe confirmation is our main tool to confirm strength within higher timeframe zones, and has really been the key to our trading success. It takes a little time to understand the subtle nuances, however, as each trade is never the same, but once you master the rhythm so to speak, you will be saved from countless unnecessary losing trades. The following is a list of what we look for:
- A break/retest of supply or demand dependent on which way you’re trading.
- A trendline break/retest.
- Buying/selling tails/wicks – essentially we look for a cluster of very obvious spikes off of lower timeframe support and resistance levels within the higher timeframe zone.
We typically search for lower-timeframe confirmation between the M15 and H1 timeframes, since most of our higher-timeframe areas begin with the H4. Stops are usually placed 1-3 pips beyond confirming structures.
EUR/USD:
Weekly gain/loss: – 40 pips
Weekly closing price: 1.1777
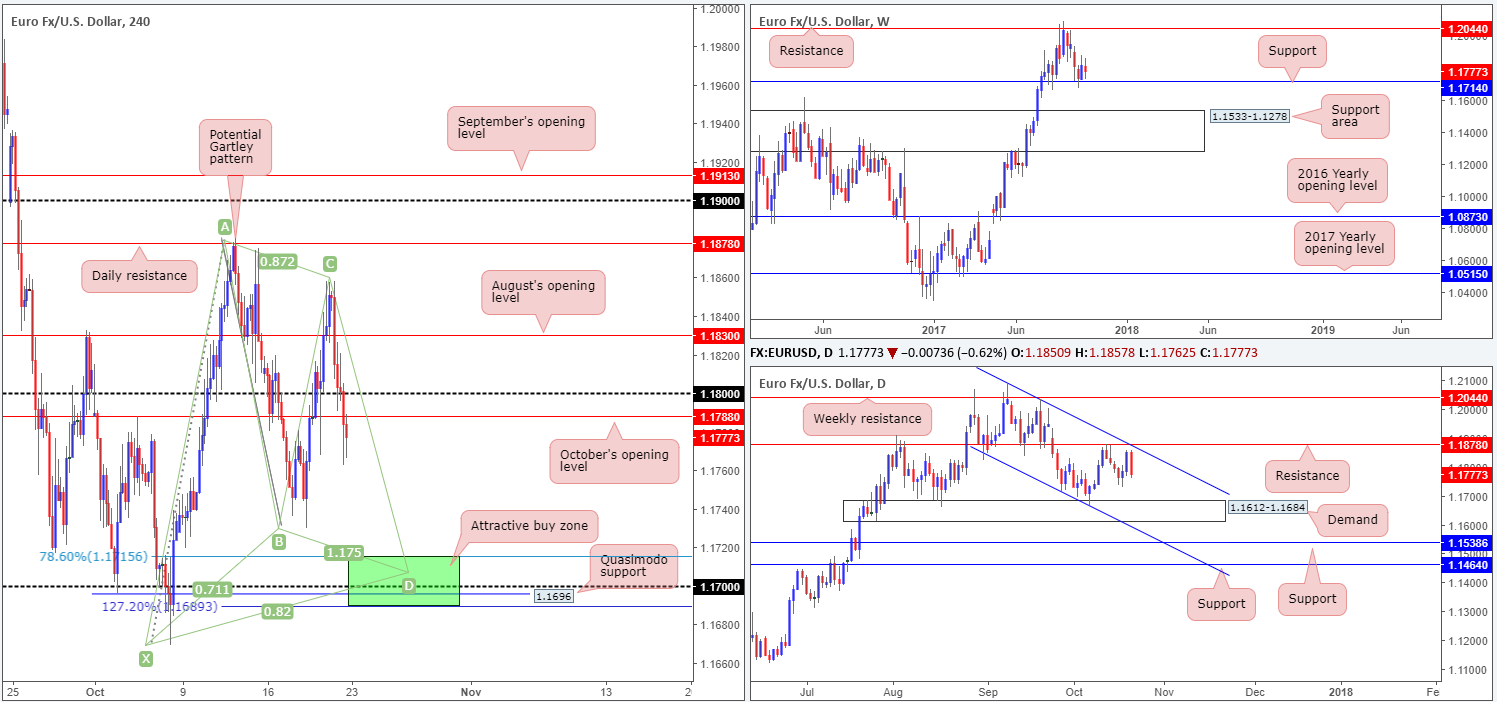
Over the course of last week’s trading, the EUR/USD maintained its position above weekly support formed at 1.1714. Although price failed to print fresh highs, we did see a weekly bullish inside bar formation take shape. This will likely interest candlestick enthusiasts, given weekly structure and the underlying trend.
The story on the daily timeframe, however, shows that Friday’s movement chalked up a near-full-bodied bearish candle that wiped out Thursday’s and most of Wednesday’s gains. What’s more, this occurred just ahead of resistance at 1.1878, which happens to fuse nicely with channel resistance etched from the high 1.2092. In the event that further selling takes place this week, demand at 1.1612-1.1684, an area that’s held its own on since early August, will likely be challenged (sited just underneath the said weekly support).
Friday’s downside move, as can be seen on the H4 timeframe, dragged the pair sub 1.18 in early US trading and eventually took out October’s opening level seen nearby at 1.1788. According to H4 structure, further downside could be on the cards, but should we be looking to sell?
Suggestions: To be quite frank, we don’t believe this to be a sellers’ market right now, due to what’s been noted on the weekly timeframe. With that being said though, a 50-pip selloff is what we’re looking for! Here’s why. The green area on the H4 chart at 1.1689/1.1715 (comprised of a Harmonic Gartley completion point at around 1.1708/1.1715, the 1.17 handle, a Quasimodo support at 1.1696, a 127.2% Fib ext. at 1.1689, the aforesaid weekly support and also located just above the top edge of daily demand at 1.1684) is an attractive base for a long. Assuming that you enter within the green area (the 1.17 handle looks nice) and set stops below the X point of the Harmonic pattern (1.1669), this is a high-probability setup, and one that we will have no hesitation in taking should the opportunity arise.
Data points to consider: No high-impacting news events scheduled today.
Levels to watch/live orders:
- Buys: 1.1689/1.1715 (stop loss: 1.1667).
- Sells: Flat (stop loss: N/A).
GBP/USD:
Weekly gain/loss: – 93 pips
Weekly closing price: 1.3185
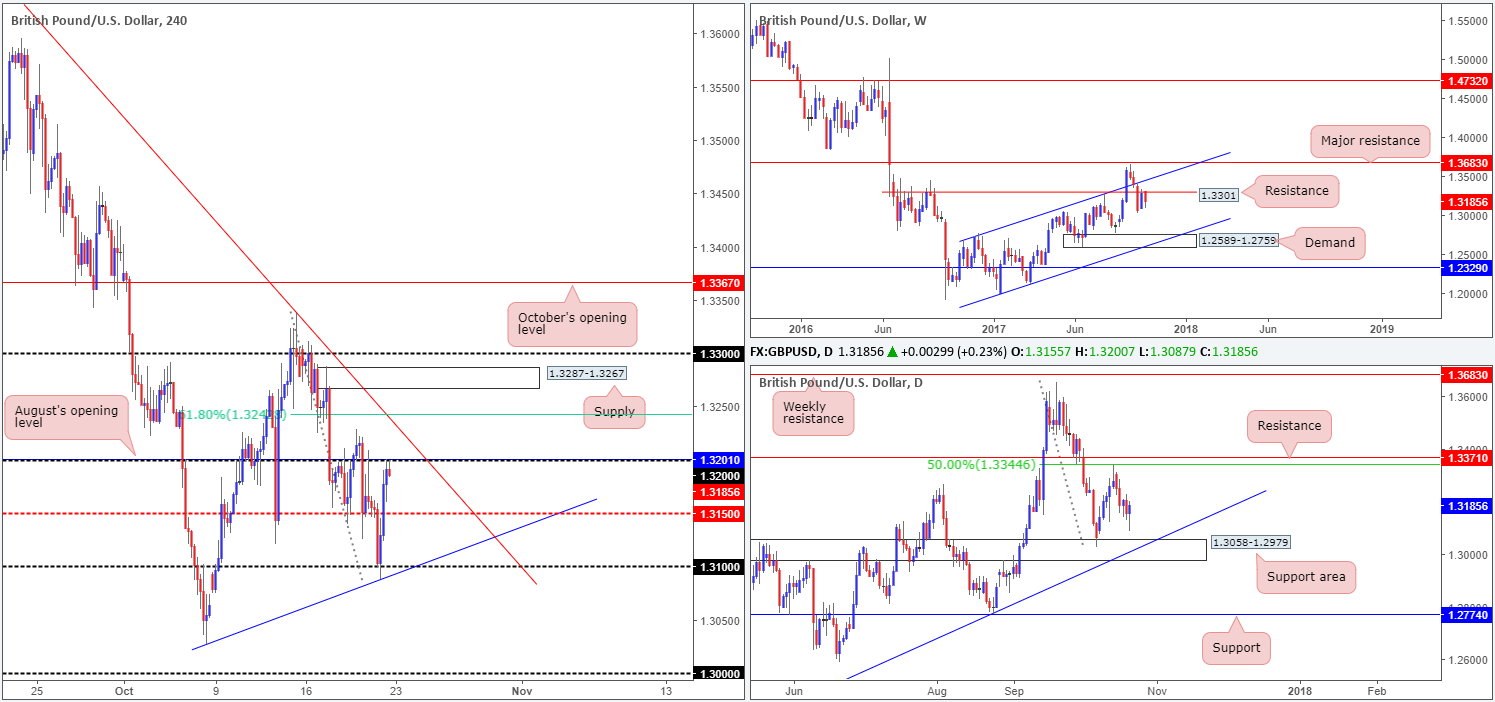
Reclaiming around 50% of the previous week’s gains, weekly bears established reasonably firm resistance from the 1.3301 point last week. Further losses from this region would likely place weekly demand at 1.2589-1.2759 in the spotlight, along with a merging weekly channel support drawn from the low 1.1986.
Moving down to the daily timeframe, the bulls made a stand on Friday just ahead of a support area at 1.3058-1.2979 that converges with a trendline support taken from the low 1.2108. This advance, which should be clear from the H4 timeframe, lifted price action beyond mid-level resistance 1.3150 and into fresh offers around the 1.32 handle by the week’s end.
Suggestions: Right now, this market does not offer any noticeable confluence worthy of trading, as far as we can see. Of course, the unit could very well selloff from the 1.32 handle today, seeing as how weekly price is trading from resistance and daily price shows room to trade as far south as the support area mentioned above at 1.3058-1.2979. Still, this is not a high-probability setup, in our book. H4 price could just as easily fake above 1.32, collect a truckload of stop orders, and tap the underside of the trendline resistance seen etched from the high 1.3657/H4 61.8% Fib resistance at 1.3243 taken from the high 1.3338.
Therefore, in light of the above, the desk plans to remain flat during Monday’s sessions.
Data points to consider: No high-impacting news events scheduled today.
Levels to watch/live orders:
- Buys: Flat (stop loss: N/A).
- Sells: Flat (stop loss: N/A).
AUD/USD:
Weekly gain/loss: – 73 pips
Weekly closing price: 0.7813
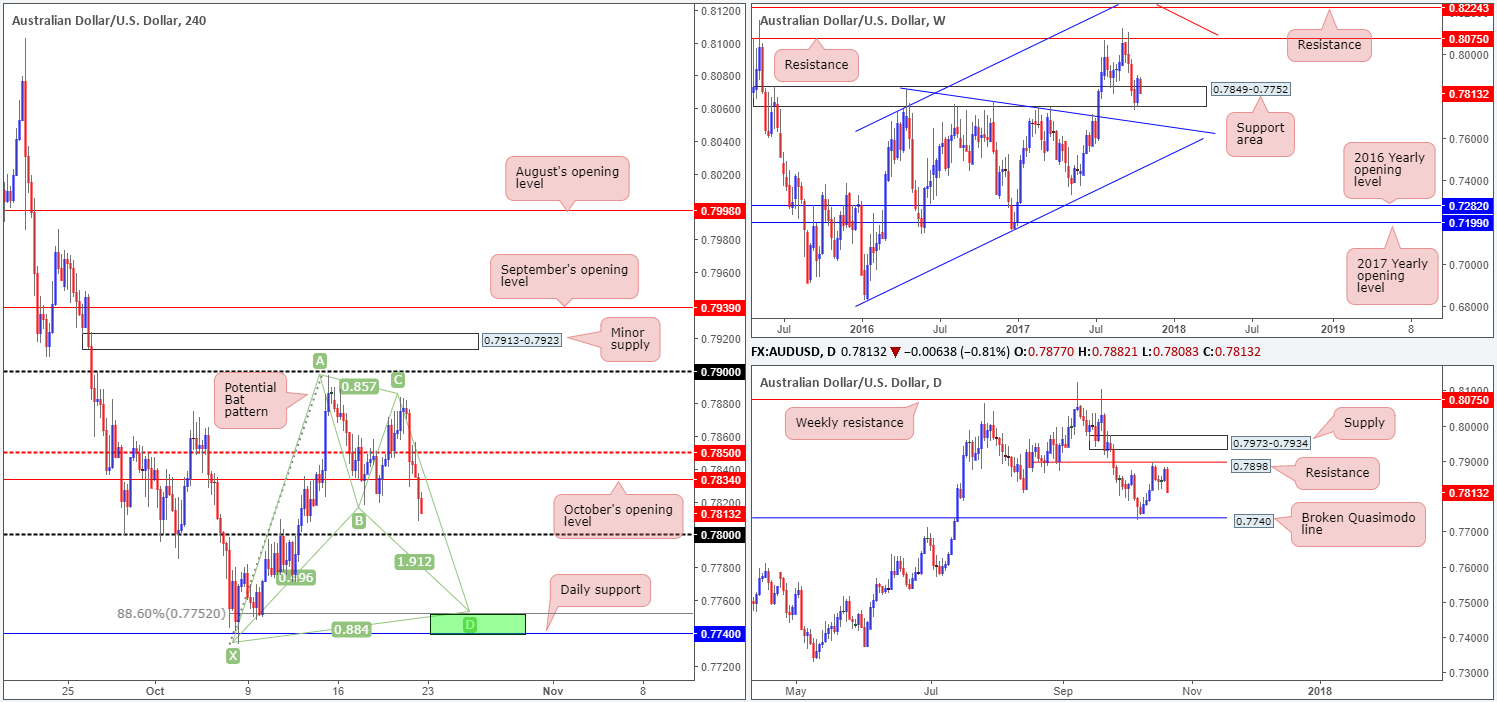
Assessing the weekly timeframe this morning, it’s clear to see that price failed to lengthen the previous week’s bounce from the support area at 0.7849-0.7752. In its place, a near-full-bodied bearish candle took form, erasing 50% of the prior week’s gains.
Since price touched gloves with daily resistance at 0.7898 on the 13th October, the pair has been under pressure. Friday’s candle molded a near-full-bodied bear candle and engulfed three prior daily candles. This, to us, is a strong sign that the market may want to retest the broken daily Quasimodo line at 0.7740 this week. Friday’s bearish descent, as we hope is demonstrated clearly on the H4 timeframe, also shows mid-level support 0.7850 and October’s opening level at 0.7834 were both taken out, leaving the 0.78 handle open for the taking!
Suggestions: Long story short, we have absolutely no intention in buying 0.78. Instead, our focus is on the daily support mentioned above at 0.7740. This is largely down to it fusing nicely with a H4 Harmonic bat completion point (or potential reversal zone) just above at 0.7752 (see green area).
A long from the green zone, with stops planted below the H4 Harmonic pattern’s X point (0.7733), is, in our technical view, a high probability buy.
Data points to consider: No high-impacting news events scheduled today.
Levels to watch/live orders:
- Buys: 0.7740/0.7752 (stop loss: 0.7730).
- Sells: Flat (stop loss: N/A).
USD/JPY:
Weekly gain/loss: + 168 pips
Weekly closing price: 113.50
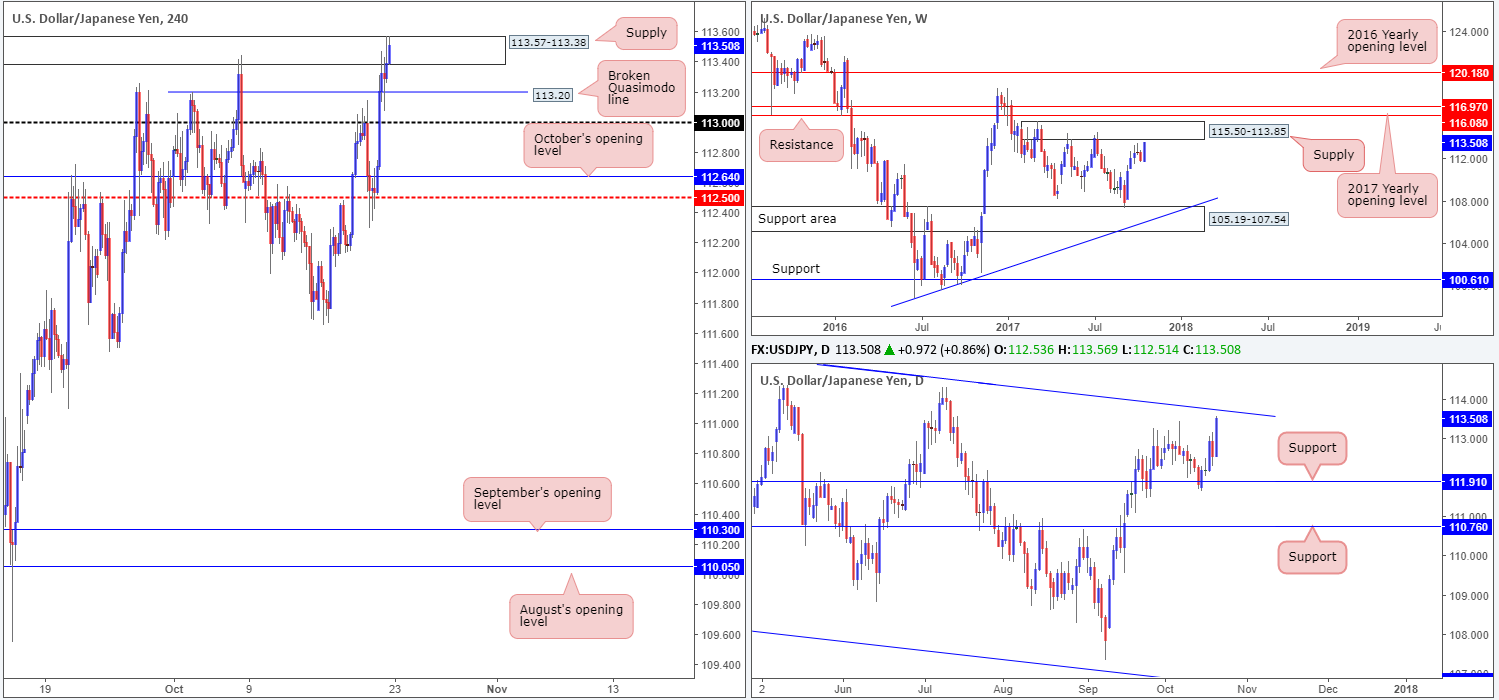
Weekly price, as you can see, turned aggressively bullish last week. Forming a near-full-bodied bull candle, the pair is now seen lurking just ahead of a supply drawn from 115.50-113.85, which has held price lower on two separate occasions so far this year. Therefore, there’s a chance that we may see history repeat itself!
In conjunction with weekly flow, daily action is also seen loitering just ahead of a channel resistance line extended from the high 115.50. The line happens to also converge beautifully with the underside of the said weekly supply.
A closer look at price action on the H4 timeframe, nonetheless, shows that the unit concluded the week closing within the upper boundaries of a supply area coming in at 113.57-113.38. Though this zone has already proved its worth back on the 6th October, it is not somewhere we would consider selling from. Preferably, we would like to see the 114 handle brought into the picture before we consider a short. Not only is 114 seen within the lower range of the noted weekly supply, it also aligns nicely with the aforesaid daily channel resistance.
Suggestions: Put simply, 114 is a high-probability sell, as far as we can see. Conservative stops would be best placed above the 11/07/17 high at 114.49, with the first downside target likely being set at the top edge of the H4 supply mentioned above at 113.57. This would be a good spot to reduce risk to breakeven.
Data points to consider: No high-impacting news events scheduled today.
Levels to watch/live orders:
- Buys: Flat (stop loss: N/A).
- Sells: 114 region (stop loss: conservative – 114.52).
USD/CAD:
Weekly gain/loss: + 152 pips
Weekly closing price: 1.2621
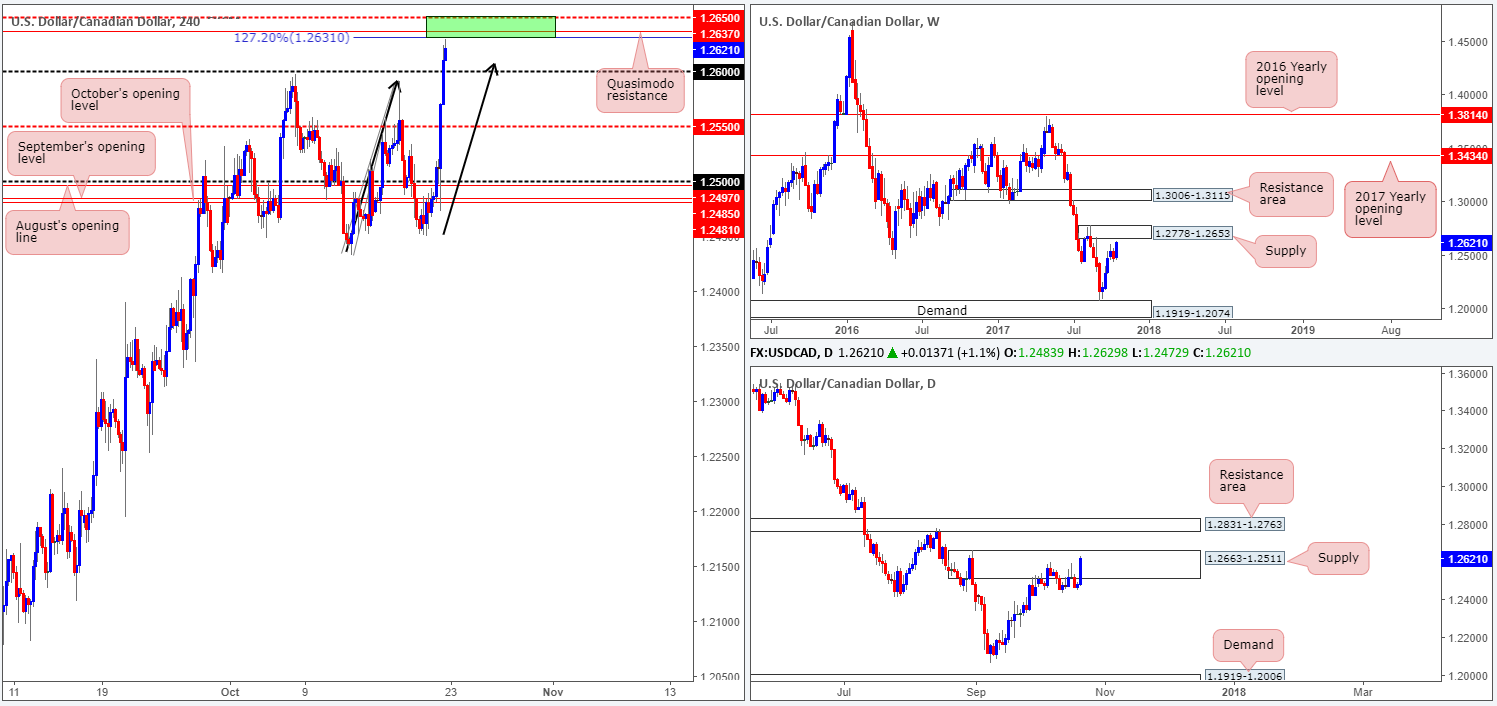
A strong wave of buying came into the market last week, forcing weekly action up to within striking distance of supply coming in at 1.2778-1.2653. This area, coupled with the clear downtrend this market has been in since May, is likely going to see the pair turn lower in the coming weeks.
Glued to the underside of the noted weekly supply is another supply seen on the daily timeframe at 1.2663-1.2511. As you can see, the bears have attempted to push lower from this area on several occasions in recent trading, but failed to print anything noteworthy.
Following Friday’s less-than-stellar CAD CPI and retail sales figures, the H4 candles rose aggressively to the upside, taking out mid-level resistance 1.2550 and the 1.26 handle. Technically speaking, we do not feel this move will be continued today. Besides the nearby weekly supply and current daily supply, we also see a nice-looking H4 Quasimodo resistance planted just above at 1.2637. Not only this though, there’s also a mid-level resistance plotted just above at 1.2650 (essentially marking the lower edge of the said weekly supply) and a 127.2% H4 AB=CD Fib ext. point at 1.2631.
Suggestions: The small green H4 zone, coupled with the aforementioned higher-timeframe supplies, makes for a strong sell, in our humble view. To be safe, we would advise placing stops a few pips above the current daily supply at around the 1.2667ish mark.
Data points to consider: No high-impacting news events scheduled today.
Levels to watch/live orders:
- Buys: Flat (stop loss: N/A).
- Sells: 1.2650/1.2631 (stop loss: 1.2667).
USD/CHF:
Weekly gain/loss: + 96 pips
Weekly closing price: 0.9839
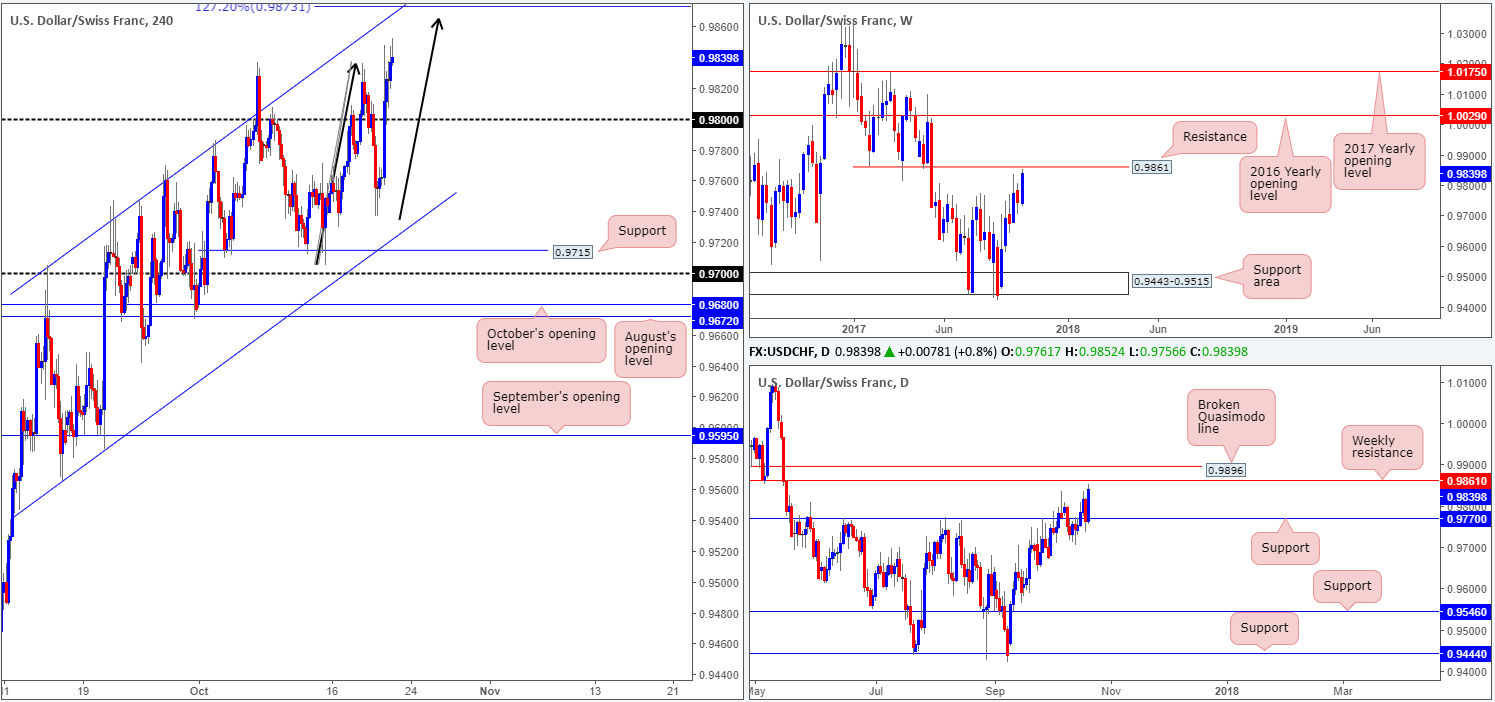
Across the board, the US dollar advanced against the majority of its counterparts last week. Consequent to this, the USD/CHF is now trading within shouting distance of a weekly resistance plotted at 0.9861. A violation of this line may signal a rally up to as far north as the 2016 yearly opening level at 1.0029, while a rejection could see weekly support at 0.9770 enter the fray.
Analyzing the daily timeframe’s structure, we can see that a break above the current weekly resistance will, almost immediately, force the candles to cross paths with a broken daily Quasimodo line at 0.9896.
Moving across to the H4 timeframe, price is currently seen trading a few pips short of a potential reversal zone around the 0.9873 mark. Bolstering this line is an AB=CD (see black arrows) 127.2% Fib ext. point and a channel resistance extended from the high 0.9705. This – coupled with the nearby weekly resistance mentioned above at 0.9861 – makes for an impressive sell, in our technical view.
Suggestions: Keeping it Simple Simon today, a short from 0.9783 is valid with stops (conservatively) positioned above the 161.8% ext. point at 0.9918 (not seen on the screen). The first take-profit target, for us, would be the 0.98 handle.
Data points to consider: No high-impacting news events scheduled today.
Levels to watch/live orders:
- Buys: Flat (stop loss: N/A).
- Sells: 0.9873 region (stop loss: conservative – above the 161.8% ext. point at 0.9918).
DOW 30:
Weekly gain/loss: 442 points
Weekly closing price: 23322
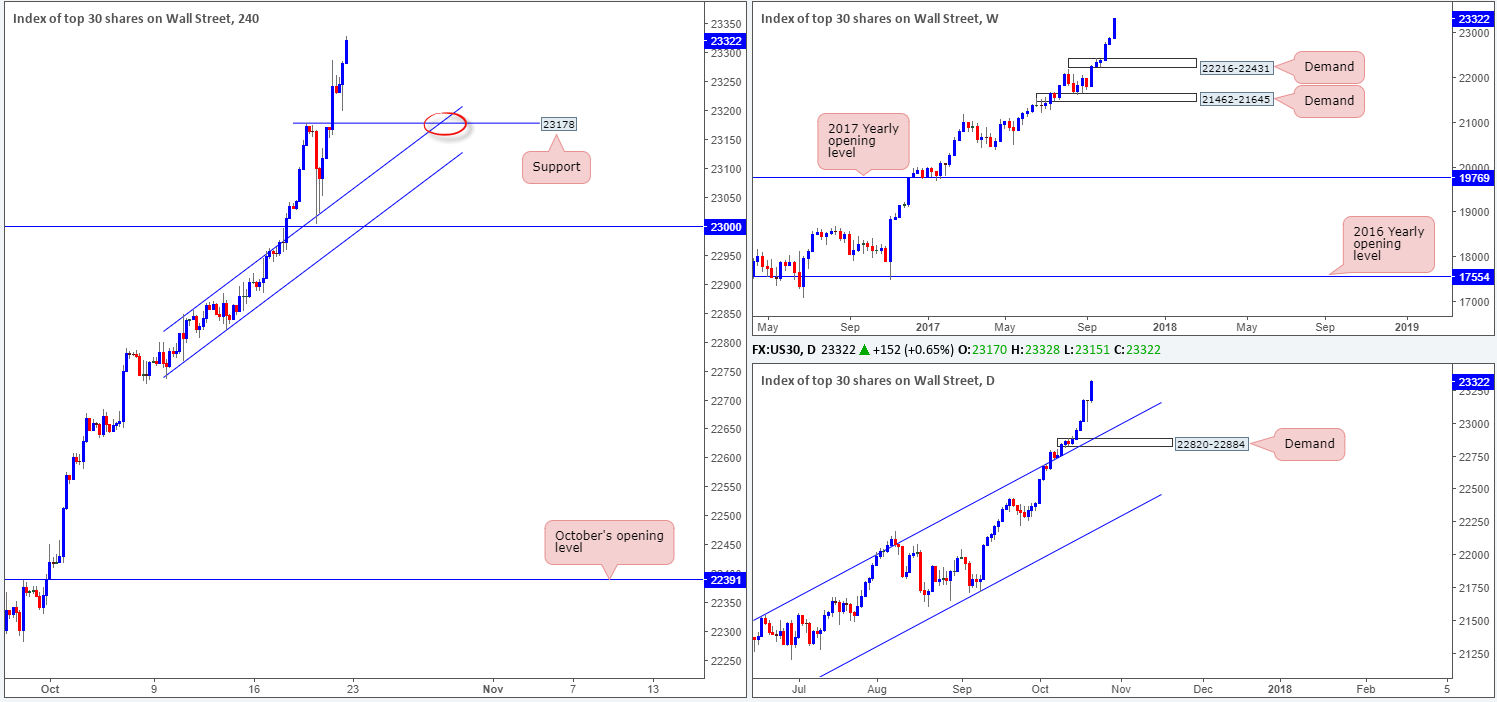
US stocks extended higher for a sixth consecutive session last week, dragging the index up to a fresh record high of 23328. Should the index pullback this week, the next weekly downside target in view is demand coming in at 22216-22431. On the daily timeframe, the closest demand base can be seen at 22820-22884. However, price would first have to get through potential support from the channel resistance-turned support taken from the high 21541.
Looking across to the H4 timeframe, the line marked at 23178 (Wednesday’s high) is, of course, a potential candidate, should the unit retrace this week. However, there is little confluence seen here other than a channel resistance-turned support etched from the high 22846, and this will not likely come into view until the end of the week.
Suggestions: Essentially, we do not see any immediate trading opportunities at present. Nevertheless, we will be keeping a close eye on the noted H4 support. Should price connect at the point where the H4 support and channel support merge (red circle), we would be looking to buy should H4 price chalk up a full or near-full-bodied bull candle.
Data points to consider: No high-impacting news events scheduled today.
Levels to watch/live orders:
- Buys: 23178/H4 channel support ([waiting for a reasonably sized H4 bullish candle to form – preferably a full or near-full-bodied candle – is advised] stop loss: ideally beyond the candle’s tail).
- Sells: Flat (stop loss: N/A).
GOLD:
Weekly gain/loss: – $24.4
Weekly closing price: 1280.0
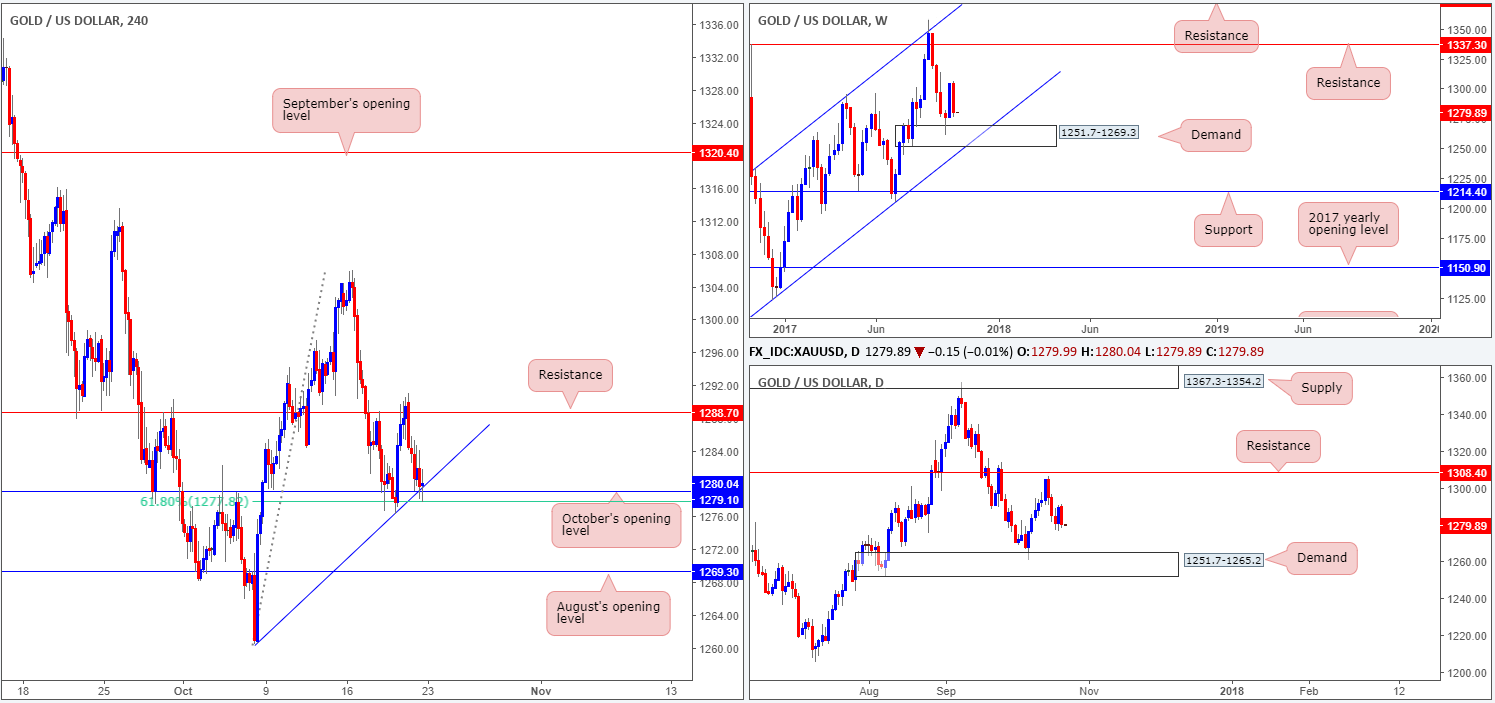
It’s amazing what a new week of trading can bring! This time last week, weekly bulls posted an incredibly strong weekly candle, following a pin-bar reaction from weekly demand at 1251.7-1269.3. Last week, however, saw price reverse almost all of the prior week’s gains, and position the unit back above the aforesaid weekly demand.
Provided that the bears maintain this posture, we could also see daily price shake hands with demand printed at 1251.7-1265.2 which happens to be sited within the lower limits of the said weekly demand.
With the US dollar reasonably well-bid on Friday, it was no surprise to see the yellow metal trade lower. H4 action wrapped up the week crossing paths with October’s opening level at 1279.1, a nearby 61.8% Fib support at 1277.8 taken from the low 1260.4 and a trendline support extended from the low also taken from 1260.4.
Suggestions: Given the current landscape, trading long from 1279.1 is not a trade we’d label high probability. A far better line for a buy trade is, in our opinion, still August’s opening level seen below at 1269.3. Besides this line being positioned just ahead of the noted daily demand, 1269.3 also denotes the top edge of a weekly demand area coming in at 1251.7-1269.3.
Levels to watch/live orders:
- Buys: 1269.3 region ([waiting for a reasonably sized H4 bullish candle to form – preferably a full, or near-full-bodied candle – is advised] stop loss: ideally beyond the candle’s tail).
- Sells: Flat (stop loss: N/A).
