Waiting for lower timeframe confirmation is our main tool to confirm strength within higher timeframe zones, and has really been the key to our trading success. It takes a little time to understand the subtle nuances, however, as each trade is never the same, but once you master the rhythm so to speak, you will be saved from countless unnecessary losing trades. The following is a list of what we look for:
- A break/retest of supply or demand dependent on which way you’re trading.
- A trendline break/retest.
- Buying/selling tails/wicks – essentially we look for a cluster of very obvious spikes off of lower timeframe support and resistance levels within the higher timeframe zone.
We typically search for lower-timeframe confirmation between the M15 and H1 timeframes, since most of our higher-timeframe areas begin with the H4. Stops are usually placed 1-3 pips beyond confirming structures.
EUR/USD:
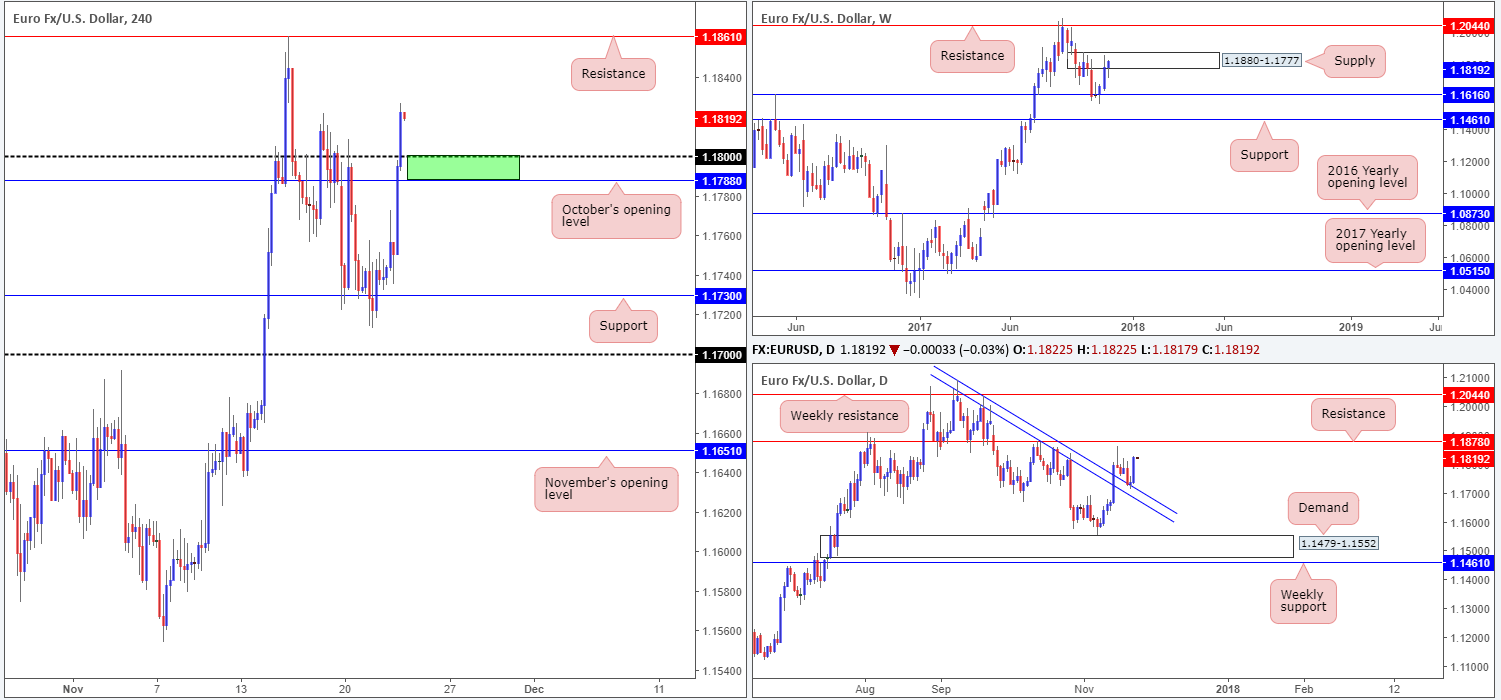
The euro made considerable ground against its US counterpart on Wednesday, running through both October’s opening level seen on the H4 timeframe at 1.1788 and, after the release of the FOMC minutes, the 1.18 handle. According to the minutes, the majority of the FOMC members saw that a near-term hike was warranted.
As you can see on the daily timeframe, recent action saw price chalk up a near-full-bodied bull candle from a trendline support etched from the high 1.2092. To the upside, however, there is a nearby well-appointed resistance level pegged at 1.1878. Against this background, nonetheless, we can see that weekly action pushed into the walls of a supply base drawn from 1.1880-1.1777. A breach of this zone would likely throw resistance at 1.2044 back onto the radar.
Suggestions: We like the idea of a bounce being seen from 1.1788/1.18 on the H4 timeframe (Oct’s open level/round number – green zone), since there is room for the unit to advance north on the daily timeframe. The only grumble here, of course, is the current weekly supply!
Unfortunately, a long from 1.1788/1.18 would be too much of a risk for our liking. However, if you have faith in the area, we would strongly advise waiting for additional confirmation in the form of a full or near-full-bodied H4 bull candle. This will help avoid an unnecessary loss should price decide to dip lower.
Data points to consider: Eurozone manufacturing 8/9am; ECB monetary policy meeting accounts at 12.30 GMT; US banks will be closed in observance of Thanksgiving Day.
Levels to watch/live orders:
- Buys: Flat (stop loss: N/A).
- Sells: Flat (stop loss: N/A).
GBP/USD:
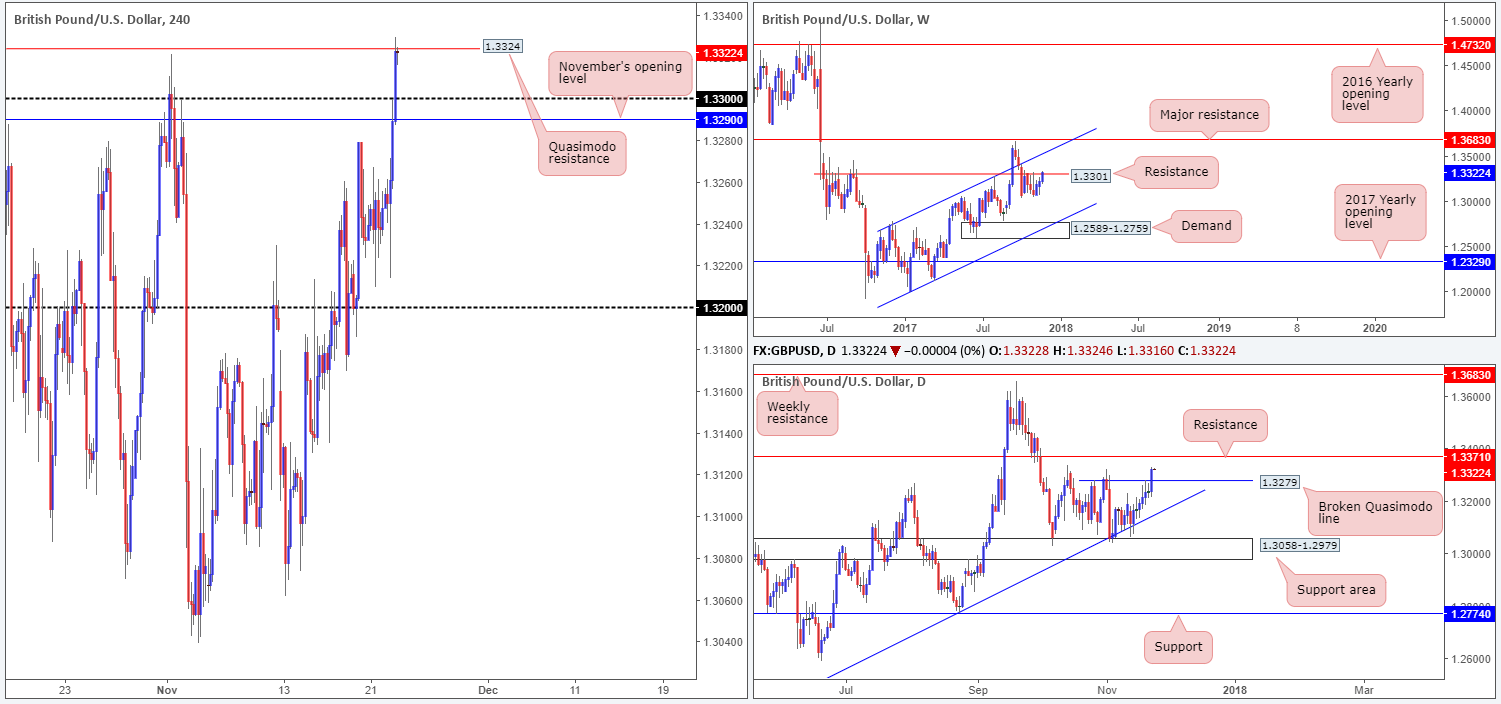
For those who follow our reports on a regular basis you may recall the team highlighting November’s opening level seen on the H4 timeframe at 1.3290 as a high-probability base to sell from. Placed nearby the 1.33 band (which essentially represents the weekly resistance level at 1.3301) and also the daily Quasimodo resistance at 1.3279, the monthly level was likely to hold firm. And it did for a couple of hours (see H1 chart). However, with the FOMC minutes only a few hours away, this would’ve been an incredibly risky short, despite sound technical structure.
After the release of the FOMC minutes, the British pound crunched through 1.33 and shook hands with a H4 Quasimodo resistance level at 1.3324, and held ground going into the closing bell. Beyond this line, the next area of concern, at least for us, would be October’s opening level placed at 1.3367, which happens to be positioned nearby daily resistance at 1.3371 (next upside target on that scale).
.Suggestions: It would be a risky move to sell the current H4 Quasimodo resistance, given the recent break of the daily Quasimodo resistance. On top of this, weekly price is seen poking its head above resistance mentioned above at 1.3301. Of course though, this doesn’t mean that the sellers are exhausted here.
As far as we can see, neither a long nor short seems attractive at current prices. The only level we would give screen time is October’s opening level because of its close connection to the aforesaid daily resistance. However, with liquidity likely to thin today, price will not likely reach this high.
Data points to consider: UK growth data at 9.30am GMT; US banks will be closed in observance of Thanksgiving Day.
Levels to watch/live orders:
- Buys: Flat (stop loss: N/A).
- Sells: Flat (stop loss: N/A).
AUD/USD:
Following the release of the FOMC minutes on Wednesday, the commodity currency drove through offers at the 0.76 handle and tapped a session high of 0.7623. Traders may have also noticed that the recent move north completed a H4 AB=CD bearish formation at 0.7620 (see black arrows). While the H4 candles are currently displaying bearish intent, we have to be prepared for the possibility that the unit may want to cross swords with the H4 resistance seen above at 0.7632. This is due to the level converging with the AB=CD 161.8% ext. point at 0.7633 and with a H4 trendline resistance taken from the high 0.8103.
Looking across to the daily timeframe, there is little immediate structure in view at the moment. The next point of interest is a supply coming in at 0.7695-0.7657. Up on the weekly timeframe, price is seen turning north ahead of a merging channel support extended from the low 0.6827, and a nice-looking AB=CD (see black arrows) 161.8% Fib ext. point at 0.7496 that also aligns with a 50.0% value at 0.7475 taken from the high 0.8125.
Suggestions: Selling from the aforementioned H4 resistance is high probability according to the H4 timeframe, but a risky move according to daily structure. This is because the lower edge of the aforementioned daily supply sits only 25 or so pips above the H4 resistance! Therefore, if you intend on selling 0.7632, we would strongly advised waiting for at least a H4 bearish candle to form, preferably in the shape of a full or near-full-bodied candle. This will help avoid a fakeout should it occur.
Data points to consider: No high-impacting events on the docket today; US banks will be closed in observance of Thanksgiving Day.
Levels to watch/live orders:
- Buys: Flat (stop loss: N/A).
- Sells: 0.7632 region ([waiting for a reasonably sized H4 bearish candle to form – preferably a full or near-full-bodied candle – is advised] stop loss: ideally beyond the candle’s wick).
USD/JPY:
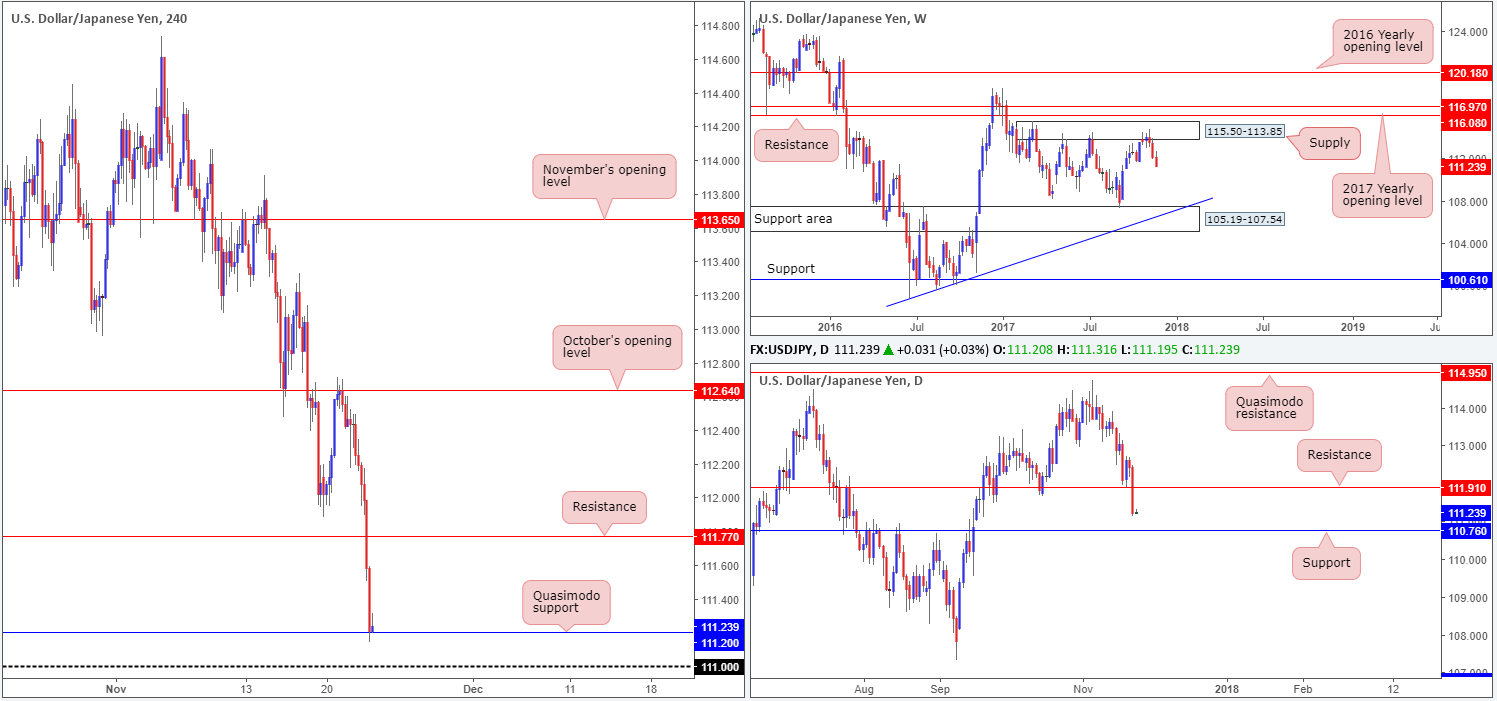
After crossing beneath H4 support at 111.70 (now acting resistance), the USD/JPY experienced further downside in the US afternoon segment as the FOMC minutes weighed on the greenback. This, as you can see, slam dunked the H4 candles into a Quasimodo support at 111.20, positioned only 20 pips above the 111 handle.
Although the pair has begun paring losses from 111.20, further downside is likely on the cards. We say this because daily price shows that the unit can press as far south as the support level at 110.76. On top of this, we know that the market is trading down from its peak 114.73 on the weekly timeframe seen within supply at 115.50-113.85.
Suggestions: We would not want to be buyers in this market at the moment as, according to our technicals, you’d be going up against higher-timeframe flow. Likewise, a sell at current price would mean shorting into both the noted H4 Quasimodo support and 111 handle. Usually, in cases such as this, we’d wait for H4 price to crack below 111 to short, but it would likely prove a pointless wait, seeing as daily support mentioned above at 110.76 is lurking just below.
In addition to the above, we are not expecting much movement in this market, given both the US and Japan have bank holidays today.
Data points to consider: No high-impacting events on the docket today; US banks will be closed in observance of Thanksgiving Day; Japanese banks will be closed due to Labor Thanksgiving Day.
Levels to watch/live orders:
- Buys: Flat (stop loss: N/A).
- Sells: Flat (stop loss: N/A).
USD/CAD:
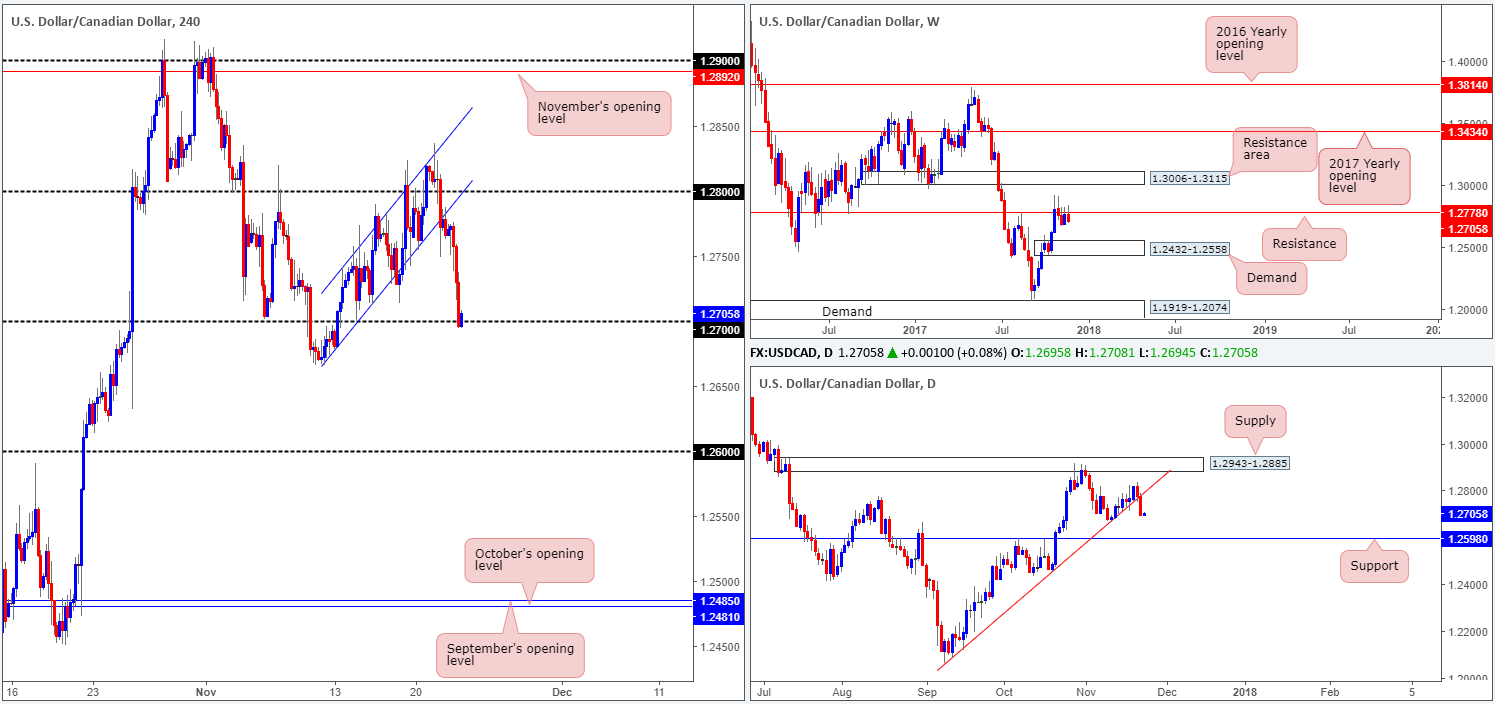
The bearish pulse continued to beat in the USD/CAD market on Wednesday. After breaking out of the H4 ascending channel formation, the pair retested the underside of the lower edge as resistance and extended lower, influenced further following the release of the minutes from the latest FOMC meeting.
Following on from Wednesday’s report where we highlighted a possible shorting opportunity should a H4 bearish candle (full or near-full bodied) take shape after retesting the underside of the H4 channel support, the team took a sell at 1.2764 and placed a stop above the candle’s wick 1.2788. We liquidated the majority of our position once price came into contact with 1.27 and moved the stop-loss order down to 1.2735. Well done to any of our readers who jumped aboard this move alongside us!
Suggestions: With the daily trendline support etched from the low 1.2061 now out of the picture, both weekly and daily timeframes show room to push lower. The closest support structure can be seen on the daily timeframe at 1.2598.
As you can see, there is a clear bearish feel to this market right now, and this is why we’re holding a portion of our position. If you missed the initial sell, however, you may be given a second chance. A decisive H4 close below 1.27, followed up with a retest and a H4 bearish candle (again full or near-full bodied) would, in our experience, be enough to warrant a sell down to 1.26, located just two pips ahead of the aforementioned daily support.
Data points to consider: US banks will be closed in observance of Thanksgiving Day; Canadian retail sales data m/m at 1.30pm GMT.
Levels to watch/live orders:
- Buys: Flat (stop loss: N/A).
- Sells: 1.2764 ([live] stop loss: 1.2735). Watch for H4 price to engulf 1.27 and then look to trade any retest seen thereafter ([waiting for a reasonably sized H4 bearish candle to form following the retest – preferably a full or near-full-bodied candle – is advised] stop loss: ideally beyond the candle’s wick).
USD/CHF:
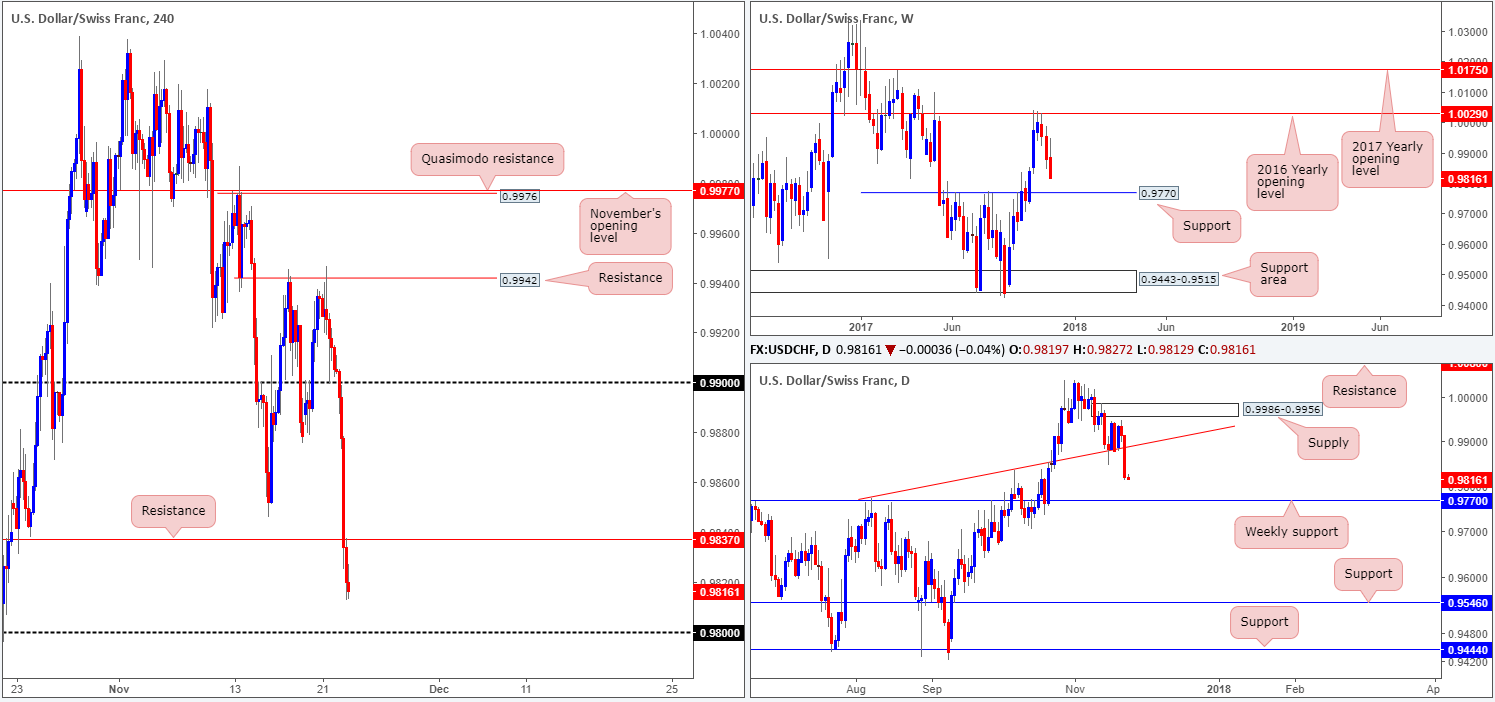
The USD/CHF is seen trading markedly lower this morning. Down nearly 1% on the day, the pair drove through a daily trendline support taken from the high 0.9773 and is now seen approaching weekly support penciled in at 0.9770. Losses were exacerbated following the release of yesterday’s FOMC minutes, as price found strong offers on the retest at the recently engulfed H4 support at 0.9837. The next port of call on the H4 scale is seen close by at 0.98.
Suggestions: Although there’s very little tickling our fancy at the moment, we would strongly advise against a long from 0.98! Why? This should be obvious. Both weekly and daily price appear poised to challenge the weekly support mentioned above at 0.9770, 30 pips below 0.98. The psychological band, therefore, is just asking to be taken out!
Data points to consider: US banks will be closed in observance of Thanksgiving Day; SNB Chairman Jordan speaks at 4.30pm GMT.
Levels to watch/live orders:
- Buys: Flat (stop loss: N/A).
- Sells: Flat (stop loss: N/A).
DOW 30:
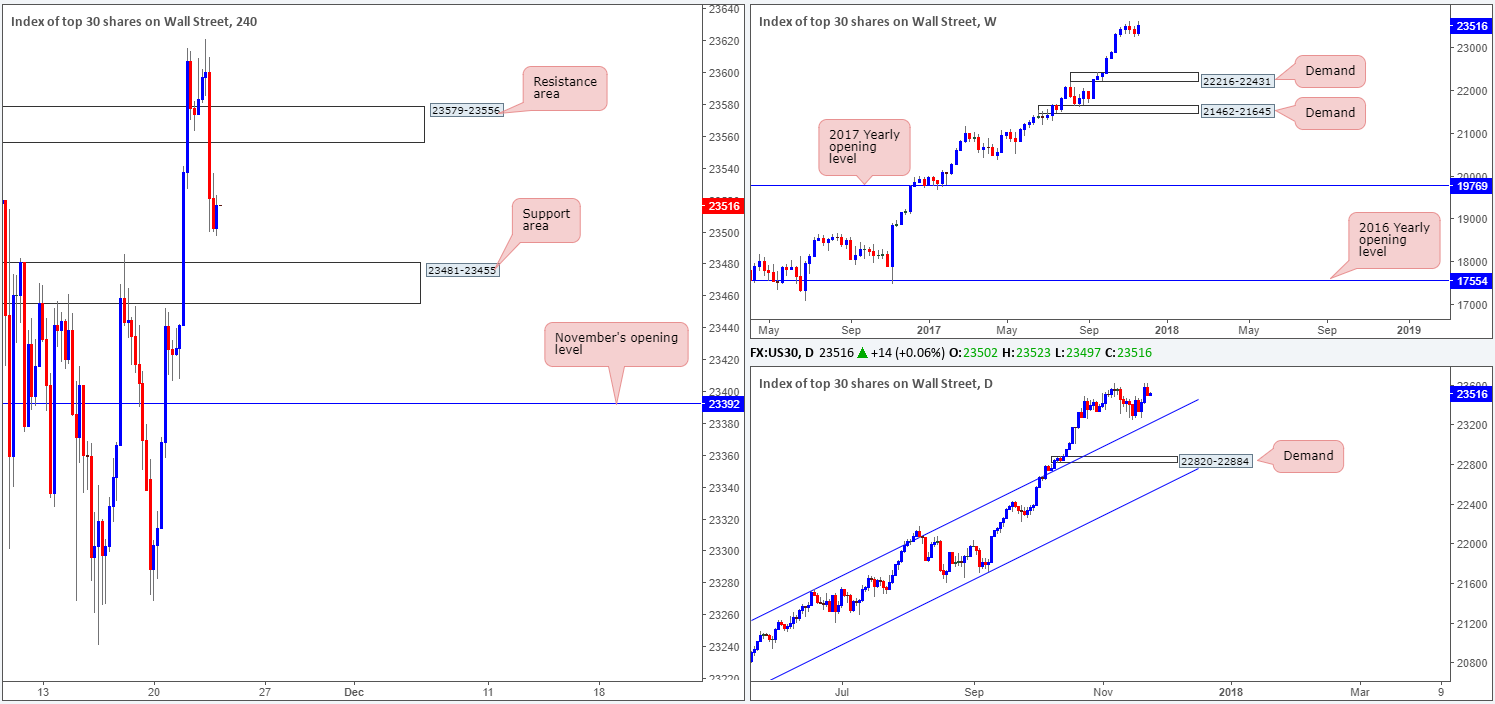
As can be seen from the H4 timeframe this morning, US equities failed to print much bullish follow-through after retesting 23579-23556, despite tapping a high of 23621. With US banks closed due to the Thanksgiving Day holiday today, we do not anticipate much movement in this market. With that, the H4 candles will likely remain loitering between the recently engulfed H4 support area (now acting resistance area) and H4 support zone at 23481-23455.
Suggestions: Remain on the sidelines. Thin volume will not likely offer much in the way of trading opportunity today.
Data points to consider: US banks will be closed in observance of Thanksgiving Day.
Levels to watch/live orders:
- Buys: Flat (stop loss: N/A).
- Sells: Flat (stop loss: N/A).
GOLD:
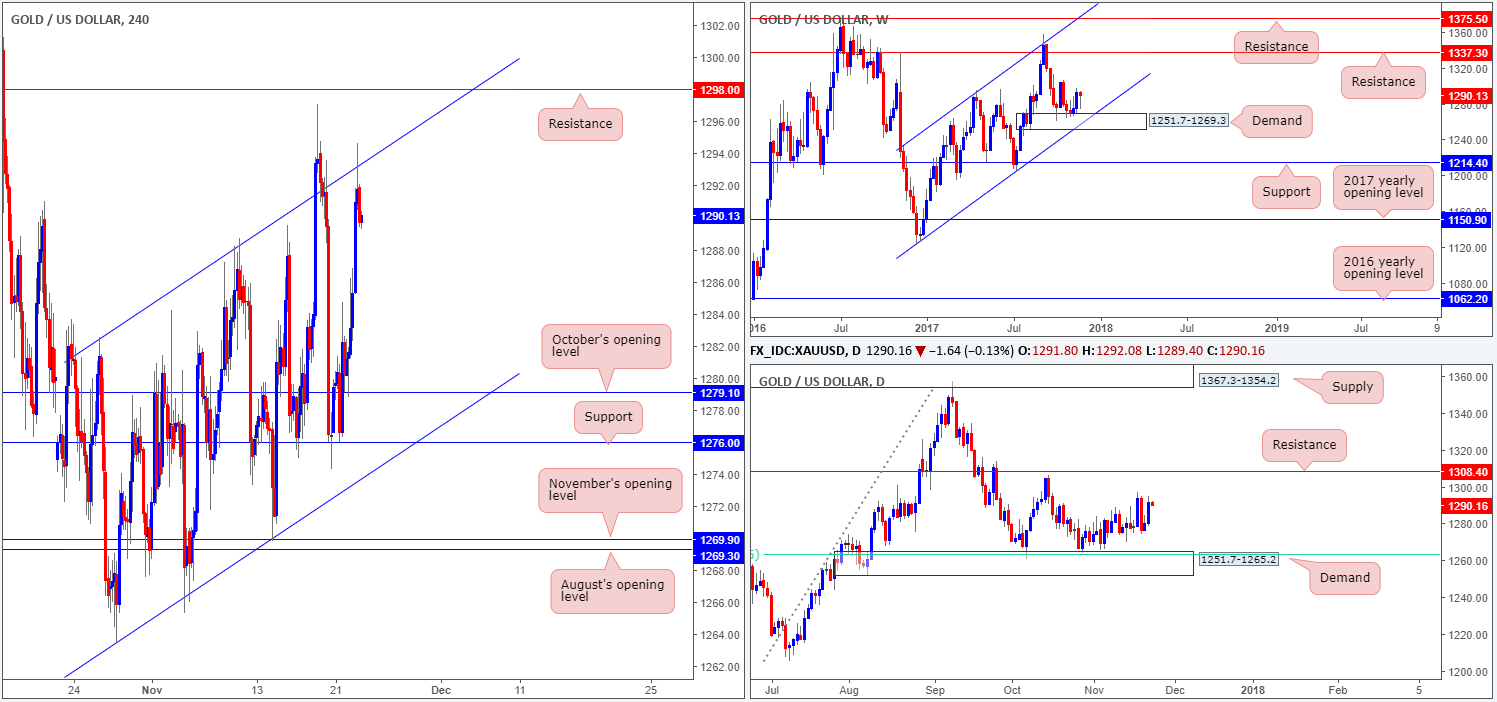
Influenced by Wednesday’s latest FOMC meeting, the dollar tumbled and correspondingly propelled the yellow metal higher. Try as it might, however, gold was unable to muster enough strength to breach the H4 channel resistance penciled in from the high 1282.5.
After connecting with daily demand at 1251.7-1265.2 (housed within the lower limits of a weekly demand base seen at 1251.7-1269.3) in late October, the gold market has since been grinding north. The next upside objective on the daily scale can be seen at 1308.4: a resistance level that boasts a reasonably strong history.
Knowing that the metal is somewhat bolstered by higher-timeframe demands at the moment, a sell in this market might be considered a risky move. Whilst we would agree that there is certainly a strong risk present, selling from the H4 channel resistance mentioned above shows some promise since there is little H4 support in view until October’s opening level coming in at 1279.1.
From our perspective though, a sell in this market is just not worth the risk, knowing that you’re potentially selling into a bunch of higher-timeframe buyers!
Suggestions: Opting to stand on the sidelines would, in our opinion, be the better, and, let’s face it, much safer path to take today.
Levels to watch/live orders:
- Buys: Flat (stop loss: N/A).
- Sells: Flat (stop loss: N/A).
