EUR/USD:
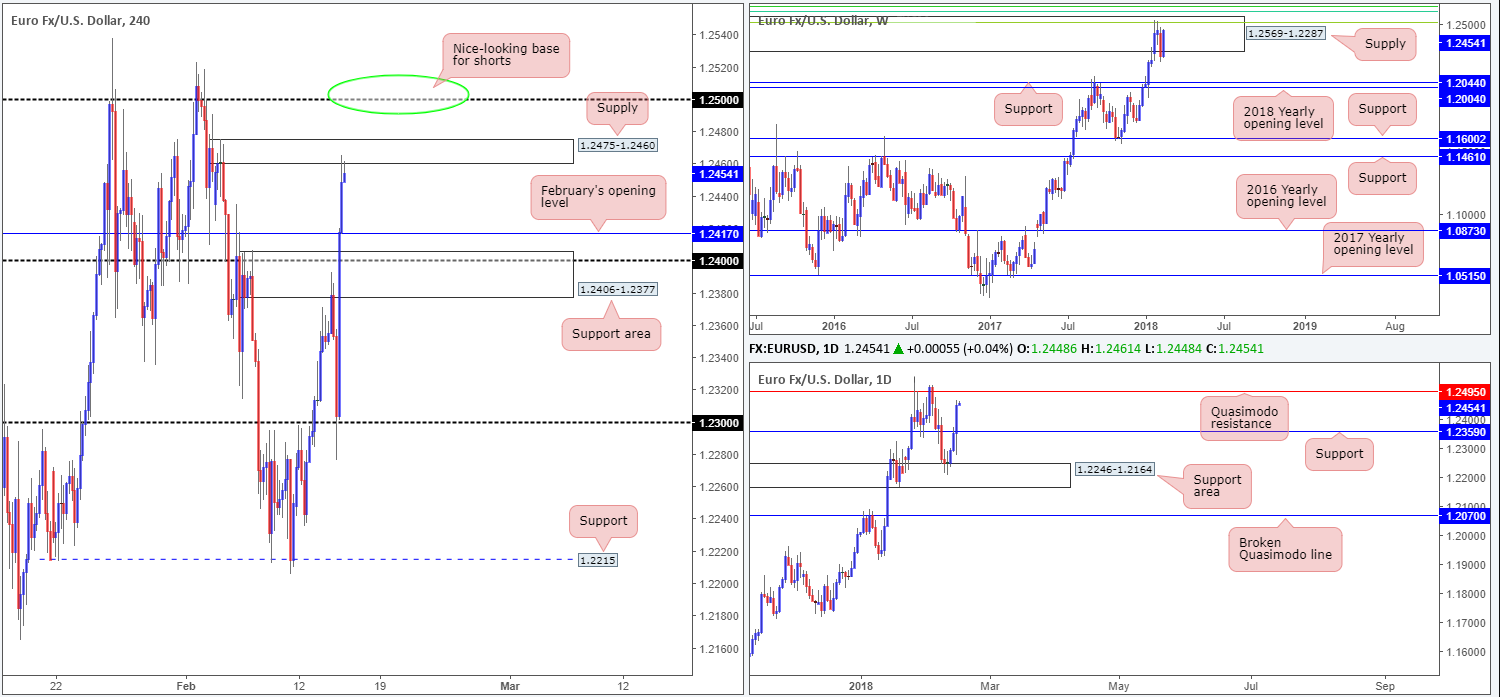
After swiftly rebounding from the 1.23 handle, the attention moved back towards the narrative of a weaker US dollar as EUR/USD prices surged. Several tech resistances were engulfed, including a daily resistance level plotted at 1.2359 (now acting support). In addition to this, we can also see that weekly price recouped all of last week’s losses and drove back into the walls of a weekly supply zone at 1.2569-1.2287. Let’s also not forget that circling around the top edge of this weekly area is a weekly Fib cluster:
- 61.8% Fib resistance at 1.2604 taken from the high 1.3993.
- 50.0% Fib resistance at 1.2644 taken from the high 1.4940.
- 38.2% Fib resistance at 1.2519 taken from the high 1.6038.
As of current prices, the H4 candles are seen attempting to pare gains from a H4 supply base coming in at 1.2475-1.2460. While this area has the potential to pull price back down to February’s opening line at 1.2417, there is a chance that we may see an extension up to the 1.25ish area as this line fuses nicely with a daily Quasimodo resistance level at 1.2495.
Potential trading zones:
The H4 supply houses little confluence, other than being positioned within the current weekly supply zone. Therefore, this is not an area we’d give praise to. The 1.25 handle, on the other hand, is attractive for shorts. Not only because of its connection with the noted daily Quasimodo resistance, but also due to it merging closely with the weekly 38.2% Fib resistance at 1.2519 that’s seen within the upper walls of the current weekly supply.
Data points to consider: US PPI m/m, Empire state manufacturing index, Philly Fed Manufacturing index and US weekly unemployment claims at 1.30pm; US industrial production m/m and capacity utilization rate at 2.15pm GMT.
Areas worthy of attention:
Supports: 1.2417; 1.2359.
Resistances: 1.2569-1.2287; weekly Fib resistance cluster; 1.2495; 1.2475-1.2460; 1.25 handle.
GBP/USD:
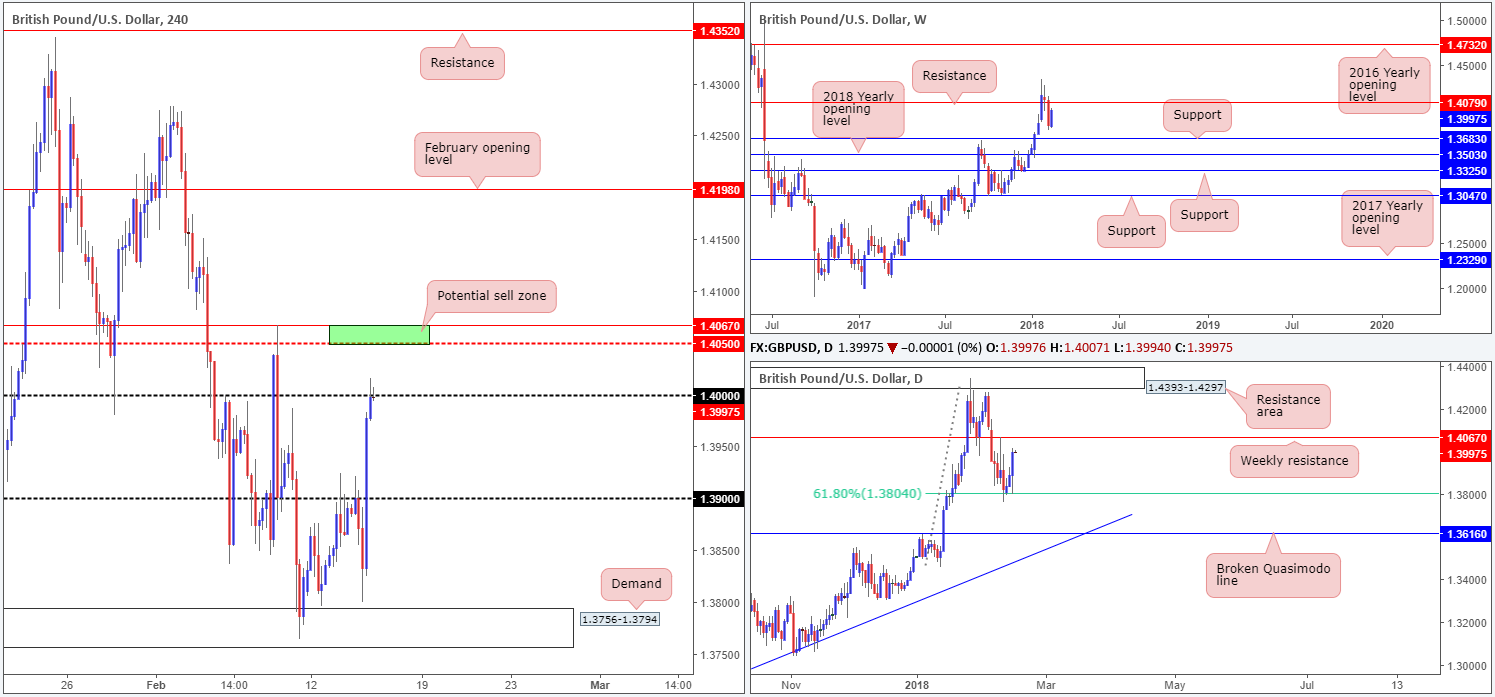
Despite a brief correction seen from the underside of the 1.39 handle, the British pound hit the brakes and aggressively reversed course on Wednesday from just ahead of a H4 demand seen at 1.3756-1.3794. The upside move, which landed H4 price back within the jaws of the large psychological 1.40 number, was, technically speaking, likely underpinned by the daily 61.8% Fib support at 1.3804.
While 1.40 is a widely watched number and is seen holding firm, as we write, traders may want to note that circling 70 or so pips above this number is a weekly resistance level drawn from 1.4067.
Potential trading zones:
Similar to the EUR/USD’s current H4 supply base, we cannot pin down any worthwhile confluence supporting the 1.40 handle this morning. Therefore, we would not label this as a zone worthy of consideration and our expectation is a move will likely be seen up the H4 mid-way point 1.4050/noted weekly resistance level. This area, in our humble view, has a higher probability of rebounding price.
Data points to consider: US PPI m/m, Empire state manufacturing index, Philly Fed Manufacturing index and US weekly unemployment claims at 1.30pm; US industrial production m/m and capacity utilization rate at 2.15pm GMT.
Areas worthy of attention:
Supports: 1.3756-1.3794; 1.39 handle; 1.3804.
Resistances: 1.40 handle; 1.4067; 1.4050.
AUD/USD:
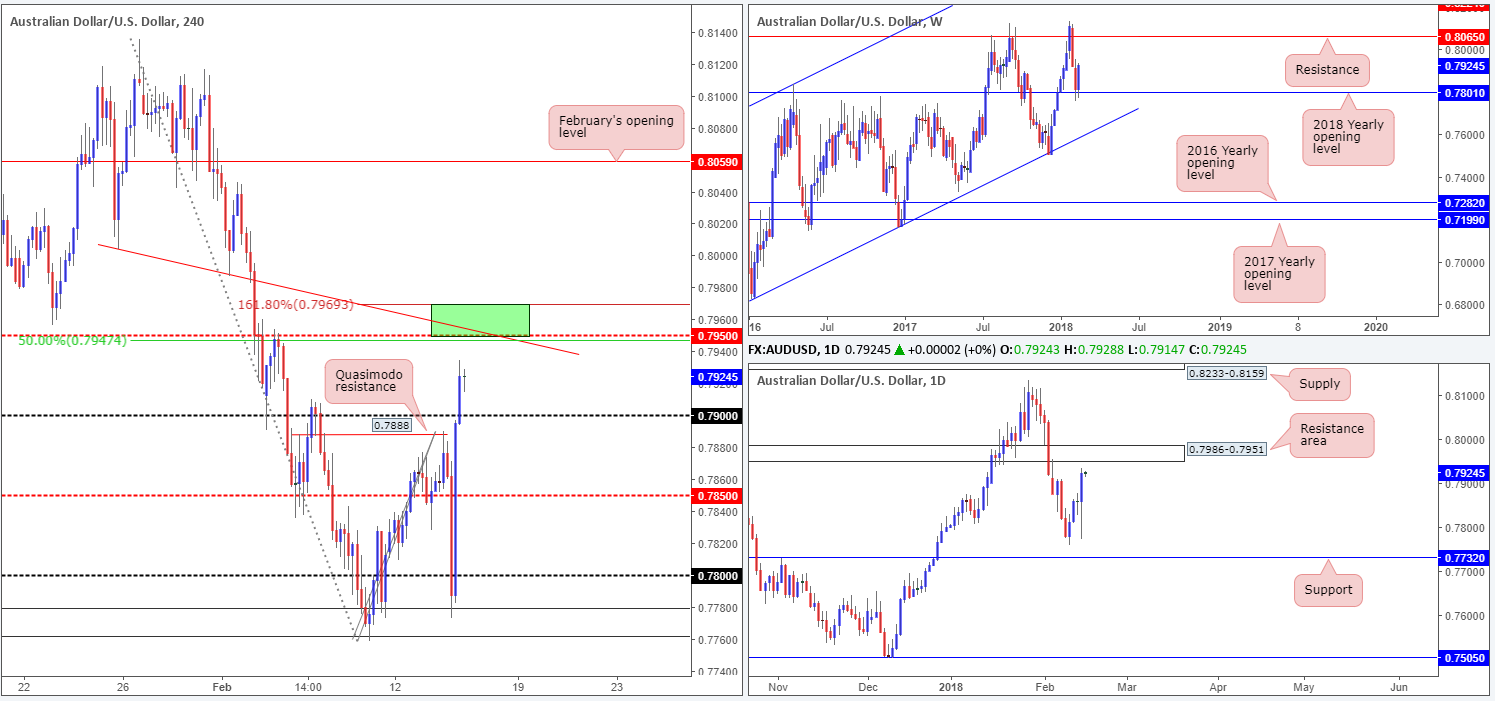
For those who follow our analysis on a regular basis you may recall that the team highlighted a potential sell zone between the 0.79 handle and a H4 Quasimodo resistance level at 0.7888. As you can see, the Aussie tested this level and declined over 100 pips amid the first half of Wednesday’s trading on the back of dollar strength. So, well done to any of our readers who took advantage of this!
The move, however, was a short-lived one. After price surpassed the 0.78 handle and tested active bids around H4 demand at 0.7762-0.7779, the market reversed immediate losses and went on to conquer the 0.79 handle into the closing bell.
Although bolstered by the fact that the pair is seen trading from a 2018 yearly opening level on the weekly timeframe at 0.7801, the commodity currency is seen trading within close proximity to a daily resistance area at 0.7986-0.7951.
Potential trading zones:
We really like the look of the 0.7969/0.7947 region on the H4 timeframe marked in green. Comprised of a H4 161.8% Fib ext. point at 0.7969, a H4 trendline resistance taken from the low 0.8004, a H4 50.0% resistance at 0.7947, a H4 mid-level resistance at 0.7950 and the underside of the aforementioned daily resistance area, this barrier is a reasonably attractive sell zone, in our technical view. Therefore, do keep an eyeball on price action around this area today should it come into the spotlight.
Data points to consider: AU. jobs figures at 12.30am; US PPI m/m, Empire state manufacturing index, Philly Fed Manufacturing index and US weekly unemployment claims at 1.30pm; US industrial production m/m and capacity utilization rate at 2.15pm GMT.
Areas worthy of attention:
Supports: 0.78/9 handle; 0.7762-0.7779; 0.7801.
Resistances: 0.7969/0.7947; 0.7986-0.7951.
USD/JPY:
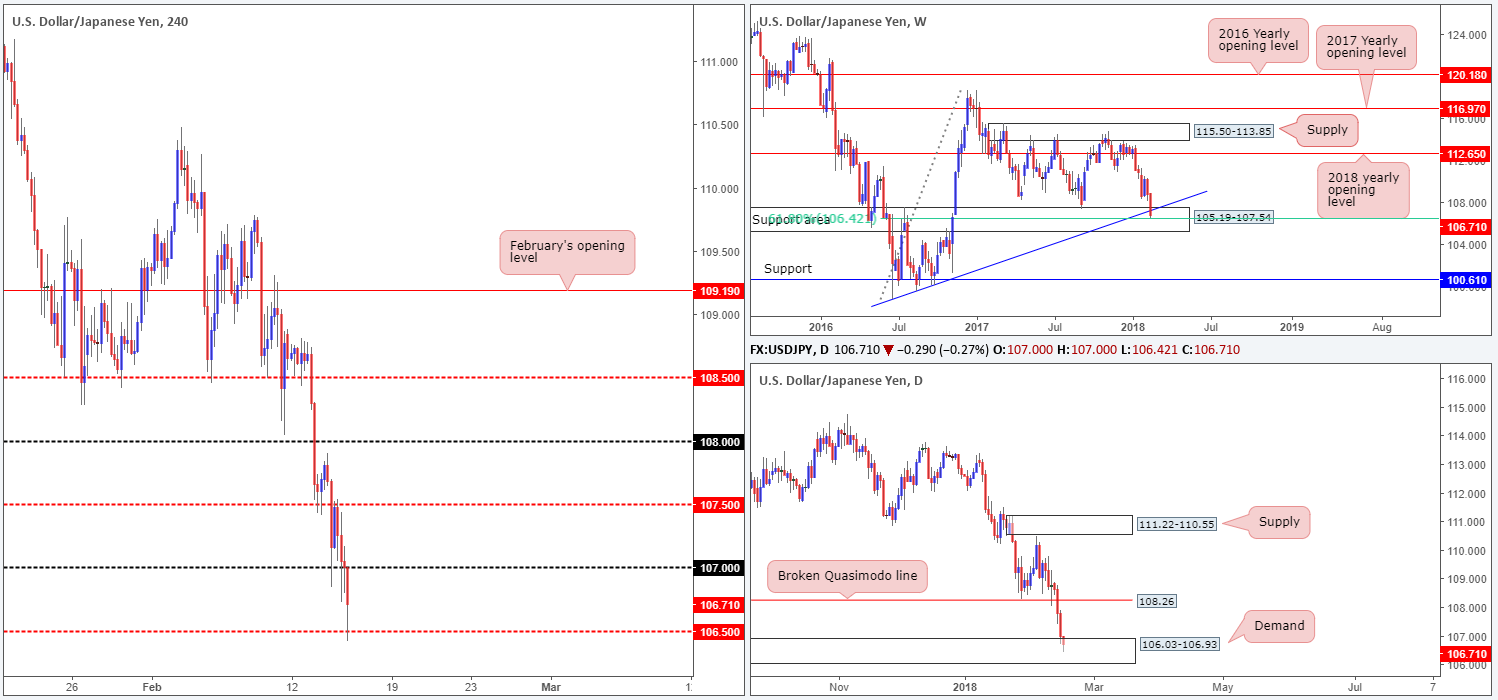
The USD/JPY pair experienced additional losses on Wednesday, consequently forcing the unit deeper into the jaws of a major weekly support area at 105.19-107.54 (intersects beautifully with a weekly trendline support etched from the low 98.78 and a weekly 61.8% Fib support at 106.42).
Alongside the weekly support area, we can also see that there’s now a daily demand area at 106.03-106.93 in the mix. This – coupled with the H4 mid-level support at 106.50 holding ground at the moment – may see the unit reverse some of the recent losses today.
Potential trading zones:
While technical structure on all three timeframes suggests a reversal could be in the midst, traders are likely wary due to downside momentum. For us, we would want to see a decisive push above the 107 handle before beginning to air bullish thoughts.
A H4 close above this number, followed up with a successful retest would, in our technical view, likely be enough to eventually bring price action up to the 107.50s and, with a little bit of oomph, the daily broken Quasimodo line at 108.26. So, do keep an eye on this number today, traders.
Data points to consider: US PPI m/m, Empire state manufacturing index, Philly Fed Manufacturing index and US weekly unemployment claims at 1.30pm; US industrial production m/m and capacity utilization rate at 2.15pm GMT.
Areas worthy of attention:
Supports: 106.50; 106.03-106.93; 105.19-107.54; 106.42; weekly trendline support.
Resistances: 107 handle; 107.50; 108.26.
USD/CAD:
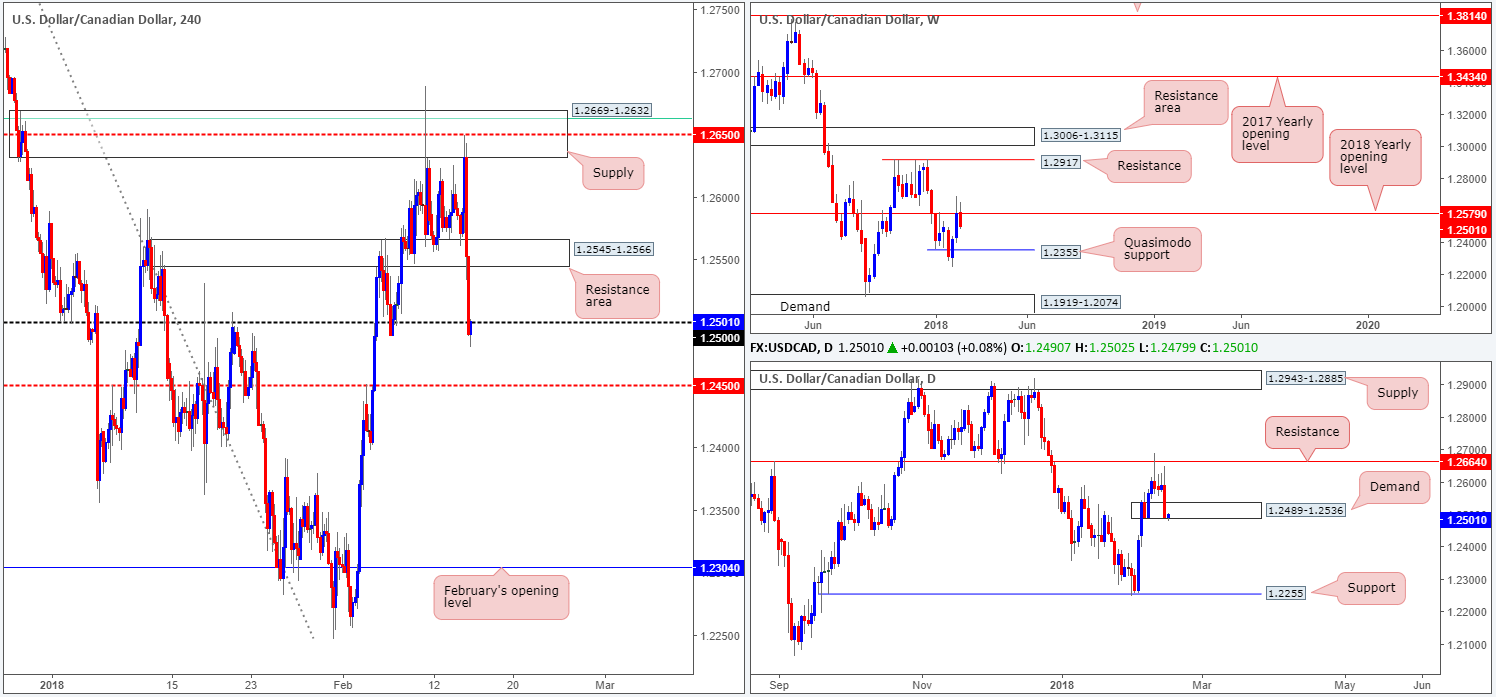
After clinching fresh highs in the mid-1.2600s, the USD/CAD quickly reversed tracks and surrendered earlier gains. Influenced by a H4 supply zone at 1.2669-1.2632, the pair managed to run through bids at a H4 support area drawn from 1.2545-1.2566 (now acting resistance area), and closed the day sub 1.25.
Stop-loss orders beneath the 1.25 handle are likely filled, as are breakout sellers’ orders. Downside from 1.25 looks reasonably clear to 1.2450.
Weekly price is seen respecting the 2018 yearly opening level at 1.2579, with room to stretch as far south as the weekly Quasimodo support at 1.2355. Down on the daily timeframe, however, the demand base seen at 1.2489-1.2536 appears incredibly fragile, suffering a mild breach of its lower edge in recent trading. Should this area give way, we see very little support on the radar until we reach the daily support band coming in at 1.2255.
Potential trading zones:
Intraday shorts from the underside of 1.25 could be an option today, targeting 1.2450. This, however, would entail selling into the lower edge of the aforementioned daily demand base, so do keep this in mind.
Apart from a quick bounce lower from 1.25, we do not see much else to hang our hat on at this time.
Data points to consider: US PPI m/m, Empire state manufacturing index, Philly Fed Manufacturing index and US weekly unemployment claims at 1.30pm; US industrial production m/m and capacity utilization rate at 2.15pm; CAD ADP non=farm employment change at 1.30pm; CAD Gov. council member Schembri speaks at 6.30pm GMT.
Areas worthy of attention:
Supports: 1.2450; 1.2489-1.2536; 1.2355; 1.2255.
Resistances: 1.25 handle; 1.2579; 1.2545-1.2566.
USD/CHF:
The USD/CHF sustained further losses on Wednesday, down 0.78% on the day. The move reflects the weakness of the US dollar against the majority of its traded peers at the moment.
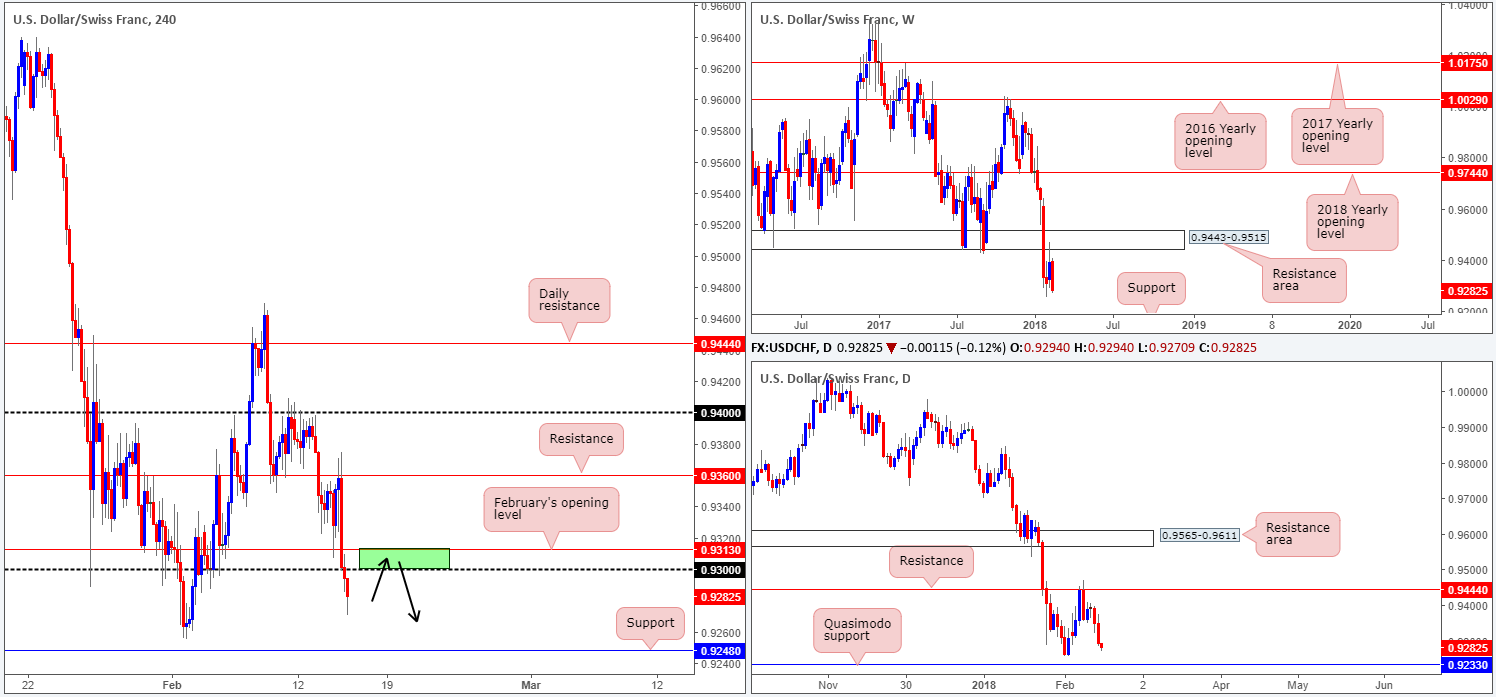
Following a retest to the underside of H4 resistance at 0.9360, the pair fell sharply. Ripping through February’s open at 0.9313 and nearby 0.93 handle, price ended the day closing a tad off the day’s lows at 0.9249. The next downside objective on the H4 scale comes in at 0.9248, followed closely by a daily Quasimodo support positioned a smidgen lower at 0.9233. According to the weekly timeframe, however, we could potentially see this market decline as far south as weekly support at 0.9163!
Potential trading zones:
The H4 green zone marked at 0.9313/0.93 (Feb’s open level/0.93 handle) is a potential area for a retest today. Although downside is reasonably clear from this point (highlighted above), we would still recommend waiting for additional H4 candle confirmation in the form of a full or near-full-bodied bearish candle. This is simply to avoid being whipsawed out of the trade on a fakeout, which is common viewing around psychological numbers.
Data points to consider: US PPI m/m, Empire state manufacturing index, Philly Fed Manufacturing index and US weekly unemployment claims at 1.30pm; US industrial production m/m and capacity utilization rate at 2.15pm GMT.
Areas worthy of attention:
Supports: 0.9248; 0.9233; 0.9163.
Resistances: 0.93 handle; 0.9313; 0.9360.
DOW 30:
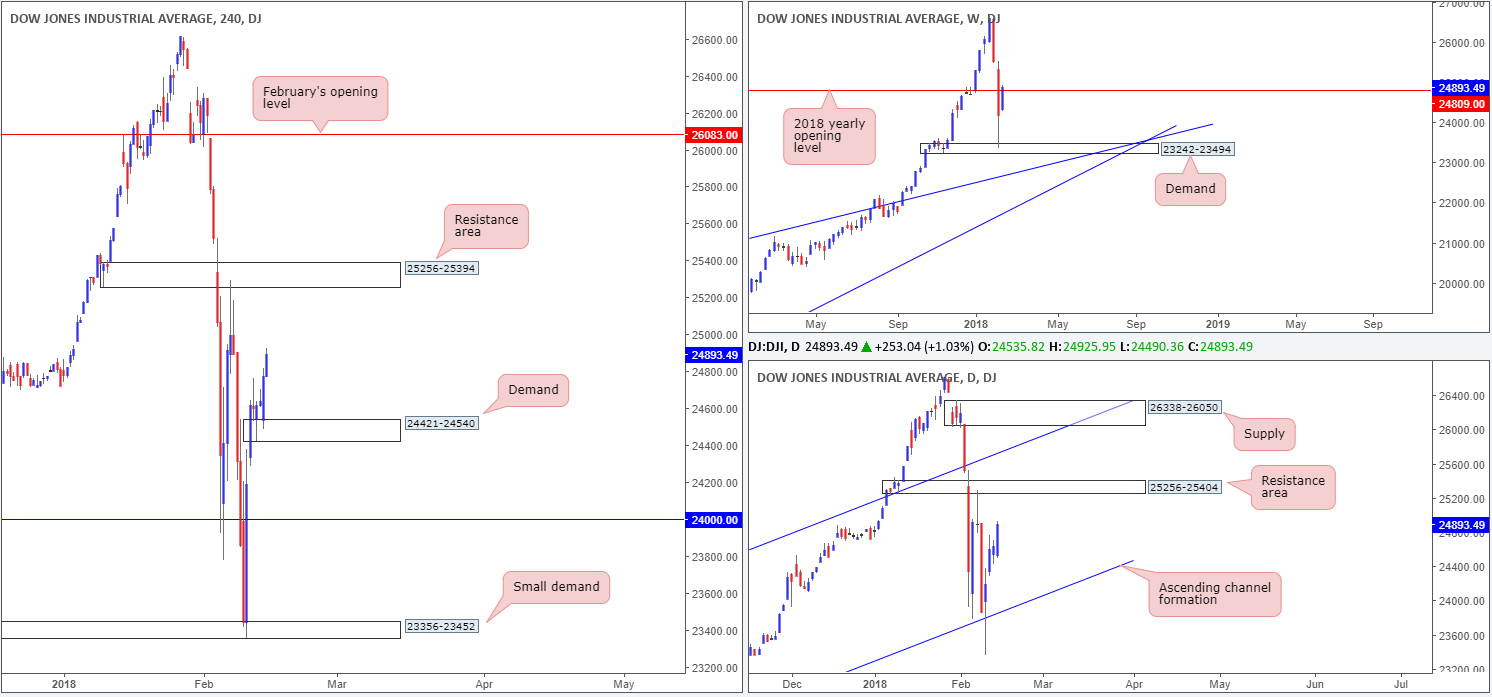
The Dow Jones Industrial Average ended Wednesday’s segment strongly in the green, as did the S&P 500 and Nasdaq 100. Amazon, Apple and Facebook led the way higher, in spite of market news.
The recent bout of buying has enabled weekly price to marginally cross back above the 2018 yearly opening point at 24809, and also bring both H4 and daily action within striking distance of the daily resistance area at 25256-25404 and its partner resistance area on the H4 at 25256-25394. As you can see, these resistance areas proved valuable in early February, so are therefore not areas to overlook!
Potential trading zones:
Should H4 price pullback today and challenge a H4 demand base seen at 24421-24540, this could be a potential buy zone, targeting the aforementioned H4 resistance area. Seeing as there is limited confluence at the noted H4 demand, however, waiting for additional candle confirmation in the form of a H4 full or near-full-bodied candle may be something to consider, before pulling the trigger.
Data points to consider: US PPI m/m, Empire state manufacturing index, Philly Fed Manufacturing index and US weekly unemployment claims at 1.30pm; US industrial production m/m and capacity utilization rate at 2.15pm GMT.
Areas worthy of attention:
Supports: 24421-24540.
Resistances: 25256-25394; 25256-25404; 24809.
GOLD:
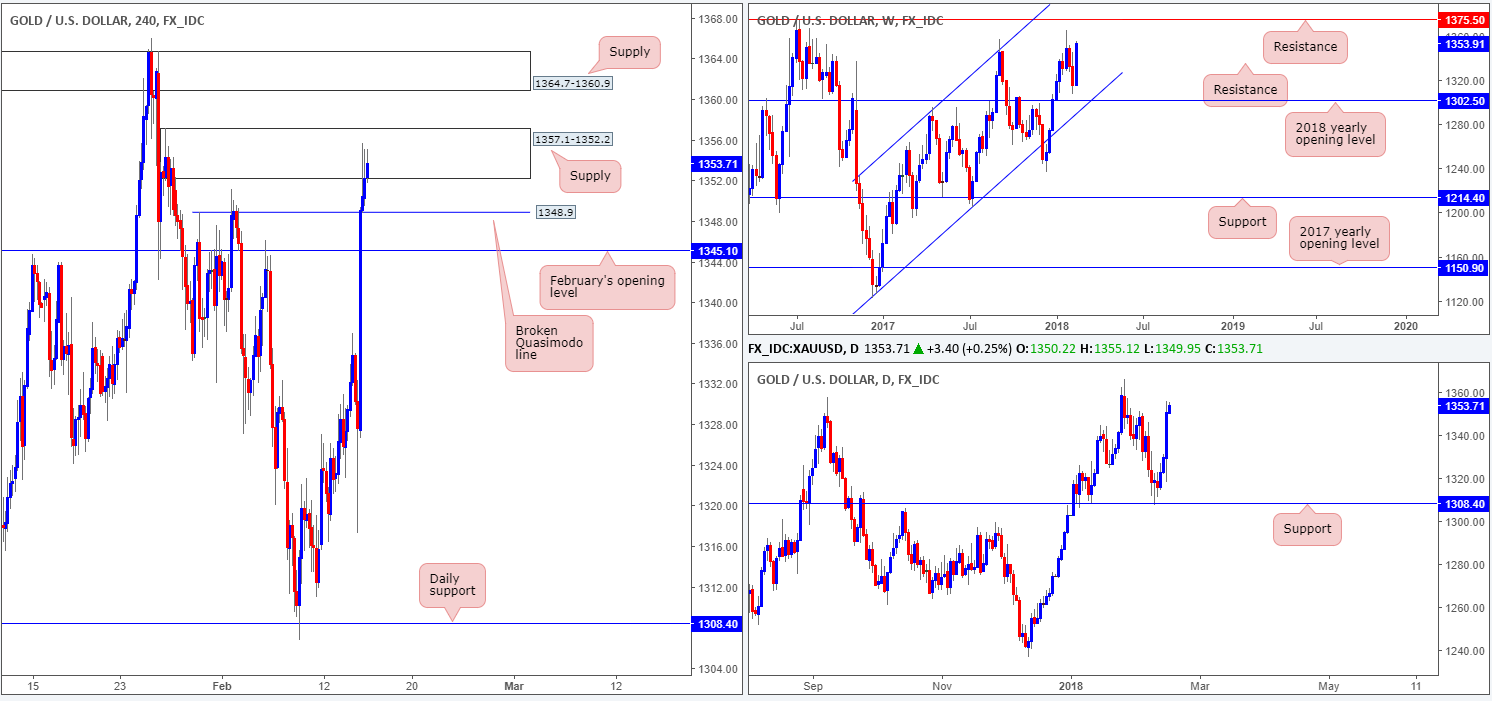
On the back of a flagging US dollar, the price of gold strengthened in recent sessions. This lifted price through February’s opening level on the H4 timeframe at 1345.1 (now acting support) and ended the day topping within the walls of a H4 supply base plotted at 1357.1-1352.2.
Solely looking at H4 price, we are somewhat restricted as far as structure is concerned. The current H4 supply, as well as the H4 supply seen directly above it at 1364.7-1360.9, limit upside, whereas to the downside, there’s a nearby H4 broken Quasimodo line seen at 1348.9, followed closely by 1345.1.
Looking over to the bigger picture, upside is less restricted according to both the weekly and daily charts this morning, with the next resistance hurdle seen positioned at 1375.5.
Potential trading zones:
Trading this market when structure is limited on the H4 timeframe is going to be a challenge from a technical standpoint. Irrespective of the direction one selects, you’ll be trading against opposing H4 structure. Therefore, opting to remain on the bench today could be the path to take.
Areas worthy of attention:
Supports: 1345.1; 1348.9.
Resistances: 1357.1-1352.2; 1364.7-1360.9; 1375.5.
This site has been designed for informational and educational purposes only and does not constitute an offer to sell nor a solicitation of an offer to buy any products which may be referenced upon the site. The services and information provided through this site are for personal, non-commercial, educational use and display. IC Markets does not provide personal trading advice through this site and does not represent that the products or services discussed are suitable for any trader. Traders are advised not to rely on any information contained in the site in the process of making a fully informed decision.
This site may include market analysis. All ideas, opinions, and/or forecasts, expressed or implied herein, information, charts or examples contained in the lessons, are for informational and educational purposes only and should not be construed as a recommendation to invest, trade, and/or speculate in the markets. Any trades, and/or speculations made in light of the ideas, opinions, and/or forecasts, expressed or implied herein, are committed at your own risk, financial or otherwise.
The use of the site is agreement that the site is for informational and educational purposes only and does not constitute advice in any form in the furtherance of any trade or trading decisions.
The accuracy, completeness and timeliness of the information contained on this site cannot be guaranteed. IC Markets does not warranty, guarantee or make any representations, or assume any liability with regard to financial results based on the use of the information in the site.
News, views, opinions, recommendations and other information obtained from sources outside of www.icmarkets.com.au, used in this site are believed to be reliable, but we cannot guarantee their accuracy or completeness. All such information is subject to change at any time without notice. IC Markets assumes no responsibility for the content of any linked site. The fact that such links may exist does not indicate approval or endorsement of any material contained on any linked site.
IC Markets is not liable for any harm caused by the transmission, through accessing the services or information on this site, of a computer virus, or other computer code or programming device that might be used to access, delete, damage, disable, disrupt or otherwise impede in any manner, the operation of the site or of any user’s software, hardware, data or property.
