EUR/USD:
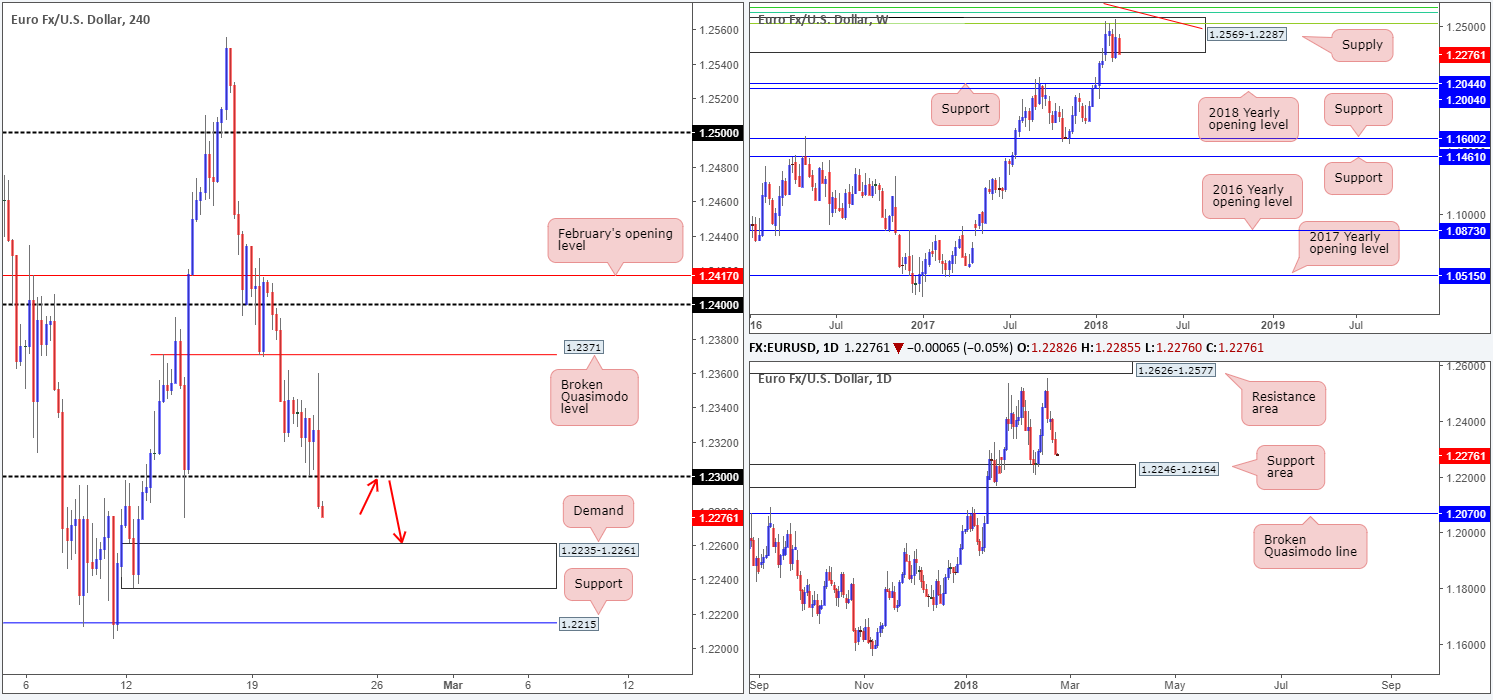
The EUR/USD sustained further losses on Wednesday, concluding the session sub 1.23. FOMC meeting minutes aired optimism regarding growth, but remained concerned about inflation. In addition to this, there is clearly a level of anxiety in the market right now as the ten-year treasury yield nears the 3% mark.
Below 1.23 on the H4 timeframe, the next downside target on the radar falls in at 1.2235-1.2261: a H4 demand base that’s followed closely by a H4 support level at 1.2215 and is also positioned on top of a daily support area at 1.2246-1.2164. Pressure from the current weekly supply at 1.2569-1.2287 will likely connect price with the noted targets today, which we believe could potentially see price action level off, and maybe even attempt to pare losses.
Potential trading zones:
With a clear bearish tone present at the moment, intraday shorts at the underside of 1.23 could be something to consider (should the unit pullback that is). The initial target from this point would be the top edge of the aforementioned H4 demand (as per red arrows).
Other than the above, we do not see much else to hang our hat on. We say this simply because once the single currency shakes hands with the daily support area, weekly and daily structure are effectively going head-to-head. This makes pinning down medium-term direction a somewhat difficult task, technically speaking.
Data points to consider: German IFO business climate at 9am; ECB monetary policy meeting accounts at 12.30pm; FOMC member Quarles speaks at 5.15am; US unemployment claims at 1.30pm; FOMC member Bostic speaks at 5.10pm GMT.
Areas worthy of attention:
Supports: 1.2215; 1.2235-1.2261; 1.2246-1.2164.
Resistances: 1.23 handle; 1.2569-1.2287.
GBP/USD:
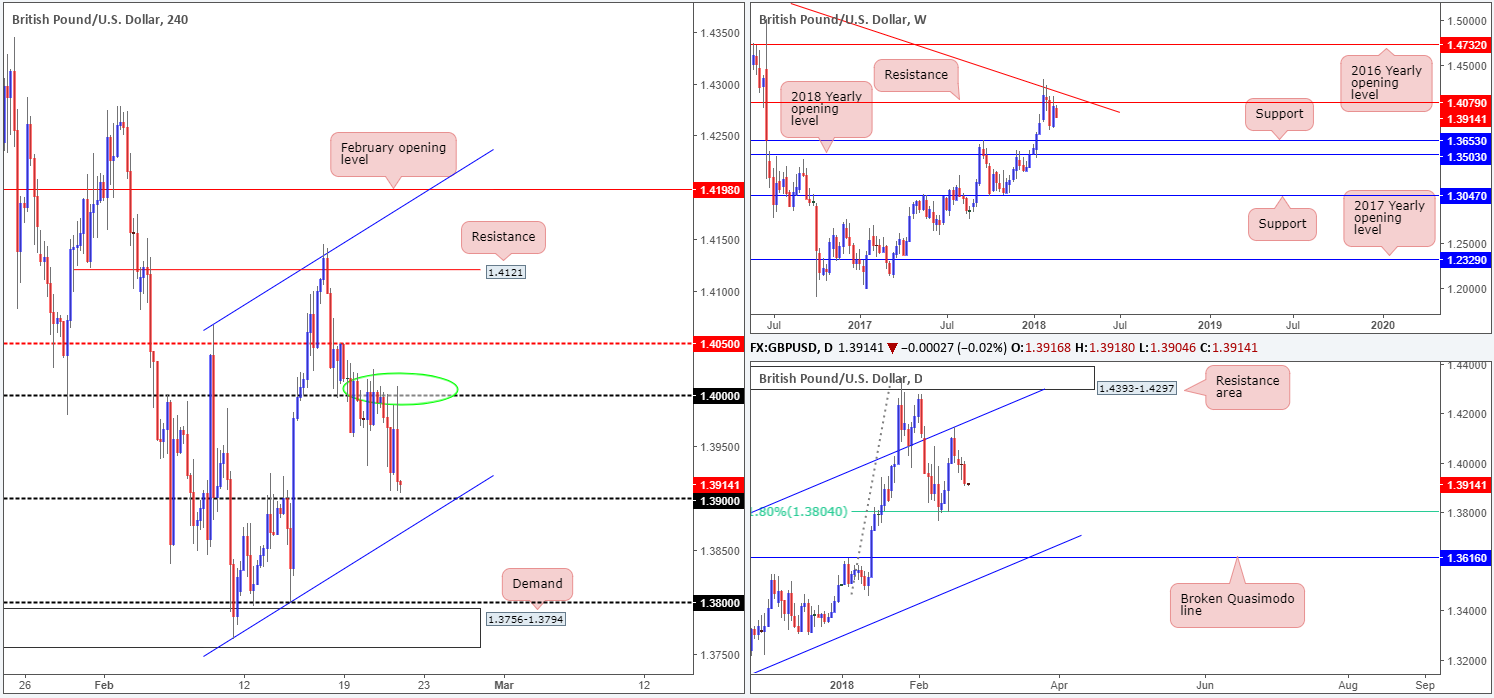
The GBP/USD came under pressure amid US afternoon trade on Wednesday, following FOMC minutes. The greenback also received a boost from ten-year treasury yield movement, which is seen nearing the 3% point, as we write.
The 1.40 handle seen marked on the H4 timeframe remained a defensive resistance on Wednesday (green circle), with the unit seen rounding off the day putting in a bottom just ahead of the 1.39 handle. Yesterday’s action also chalked up a near-full-bodied daily bearish candle, which has brought daily flow into striking distance of a 61.8% daily Fib support at 1.3804. Looking up to weekly structure, the pair is capped by a weekly resistance plotted at 1.4079, which, as you can see, is closely situated near a weekly trendline resistance etched from the high 1.5930.
Potential trading zones:
Although the 1.39 handle looks appealing, given its close connection with a H4 channel support extended from the low 1.3764, we would advise caution. Buying from here would entail entering long against potential weekly and daily flow, i.e. one has absolutely no higher-timeframe support backing this level, according to our drawings. Therefore, our focus turns to a possible break of the noted H4 channel support. A decisive H4 push below here, followed up with a successful retest (preferably in the shape of a full or near-full-bodied H4 bear candle) would, in our humble opinion be enough to sell this market. For this trade, we only see one logical take-profit zone: the H4 demand base located at 1.3756-1.3794, which happens to be positioned just beneath the 1.38 handle and noted daily Fib support.
Data points to consider: UK growth data q/q at 9.30am; FOMC member Quarles speaks at 5.15am; US unemployment claims at 1.30pm; FOMC member Bostic speaks at 5.10pm GMT.
Areas worthy of attention:
Supports: 1.39 handle; 1.3804.
Resistances: 1.4079; 1.40 handle.
AUD/USD:
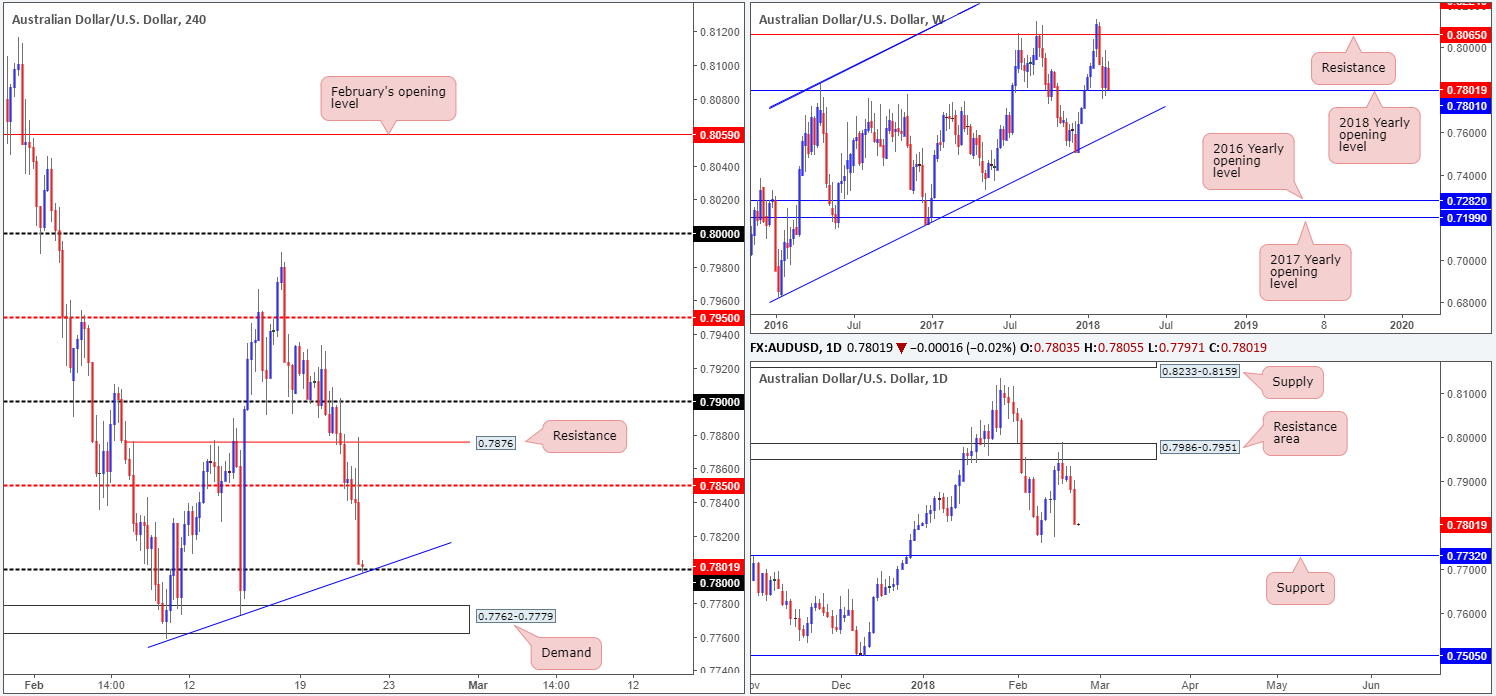
The initial read of the FOMC meeting minutes sent the commodity currency northbound on Wednesday, whipsawing through the H4 mid-level resistance at 0.7850 and connecting with H4 resistance at 0.7876, before collapsing lower. As we hope is demonstrated on the H4 chart this morning, price finished the day bottoming just ahead of the psychological handle 0.78, which is seen intersecting with a H4 trendline support taken from the low 0.7758.
Longer term, however, recent movement has brought the Aussie dollar back down to the 2018 yearly opening level printed at 0.7801 on the weekly timeframe, an area which offered support the week prior. A closer look at the action on the daily timeframe shows that yesterday’s descent chalked up a dominant bearish candle that closed on its lows. This has likely excited momentum traders and could see the unit cross swords with nearby daily support at 0.7732 sometime today.
Potential trading zones:
Although daily price indicates that further downside could be in store, weekly and H4 structure portend a possible rotation back to the upside. For that reason, today’s spotlight will firmly be focused on a possible rotation from the 0.78 vicinity, targeting 0.7850 as an initial take-profit zone. However, as most traders are aware, psychological numbers tend to prompt fakeouts, presumably to run stops. As such, entering long at market here may not be the best path to take. Waiting for the H4 candles to print a bullish rotation could, therefore, be an alternative to consider before pulling the trigger.
Data points to consider: FOMC member Quarles speaks at 5.15am; US unemployment claims at 1.30pm; FOMC member Bostic speaks at 5.10pm GMT.
Areas worthy of attention:
Supports: 0.78 handle; H4 trendline support; 0.7801; 0.7732.
Resistances: 0.7850.
USD/JPY:
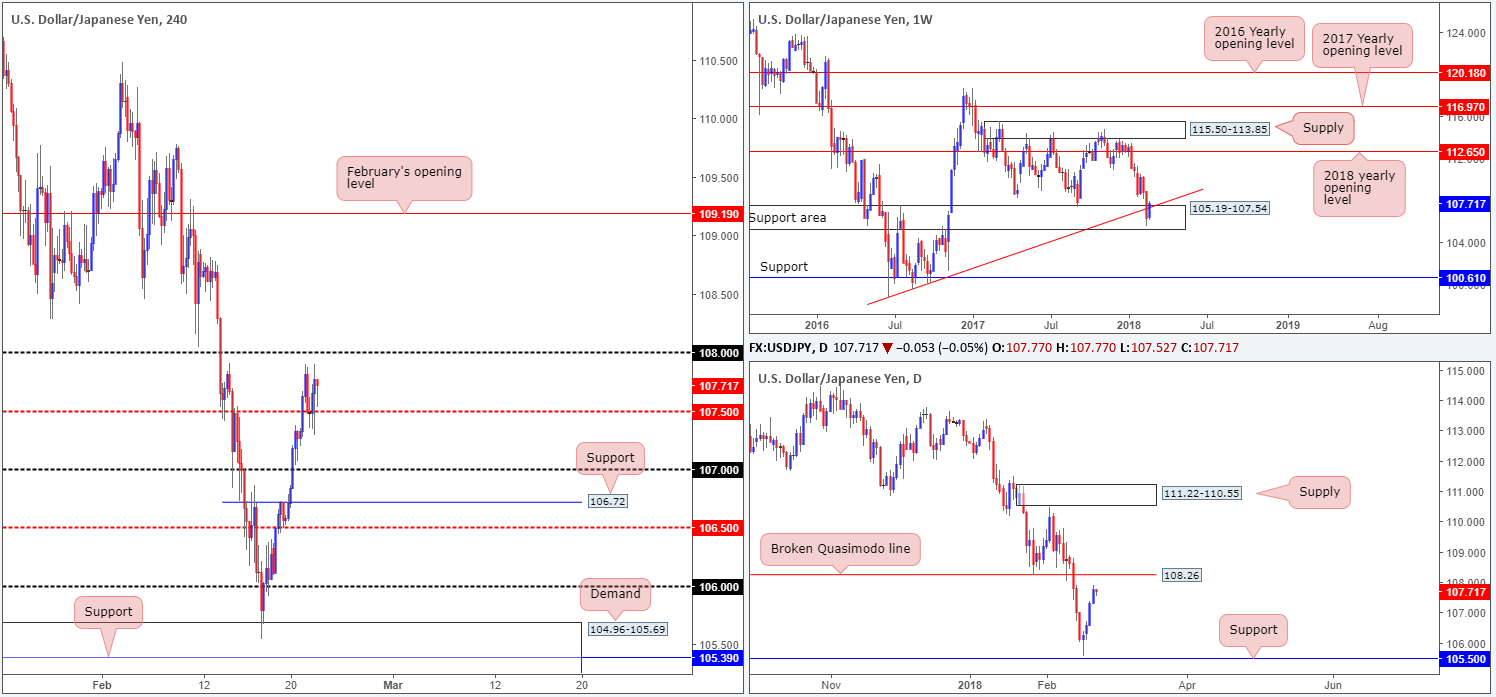
Bolstered by a robust DXY, the USD/JPY extended gains for a fourth consecutive day on Wednesday and reached highs of 107.90. As you can see on the H4 chart, the pair used the mid-level 107.50 as support throughout the London/US session, but failed to reach the nearby 108 handle.
As highlighted in Wednesday’s morning report, weekly price continues to show signs of recovery from within the limits of a weekly support area at 105.19-107.54. What’s more, the unit marginally crossed above the weekly trendline support-turned resistance extended from the low 98.78.
Looking down on the daily candles, we can see that the latest push north has placed the pair within reaching distance of a daily broken Quasimodo line coming in at 108.26. This, in our opinion, is a clean line of resistance. Therefore, despite weekly price trading from a support area right now, this is NOT a line that should be overlooked!
Potential trading zones:
Although the US dollar is airing bullish intent right now, buying the USD/JPY is proving to be difficult. Not only do we have the 108 handle lurking nearby, we still also have to take into account the possibility of selling seen from the noted weekly trendline resistance and the aforementioned broken daily Quasimodo line.
Although difficult, it is not impossible! Should the pair retest 107.50 again, and assuming that one is able to drill down to the lower timeframes and pin down a setup that requires a small enough stop to accommodate reasonable risk/reward up to 108, then we feel this would be a high-probability buy.
Data points to consider: FOMC member Quarles speaks at 5.15am; US unemployment claims at 1.30pm; FOMC member Bostic speaks at 5.10pm GMT.
Areas worthy of attention:
Supports: 107.50; 105.19-107.54.
Resistances: 108.26; 108 handle; weekly trendline resistance.
USD/CAD:
During the course of Wednesday’s sessions, the US dollar rose against its Canadian counterpart on the back of robust treasury yields, FOMC meeting and waning oil prices.
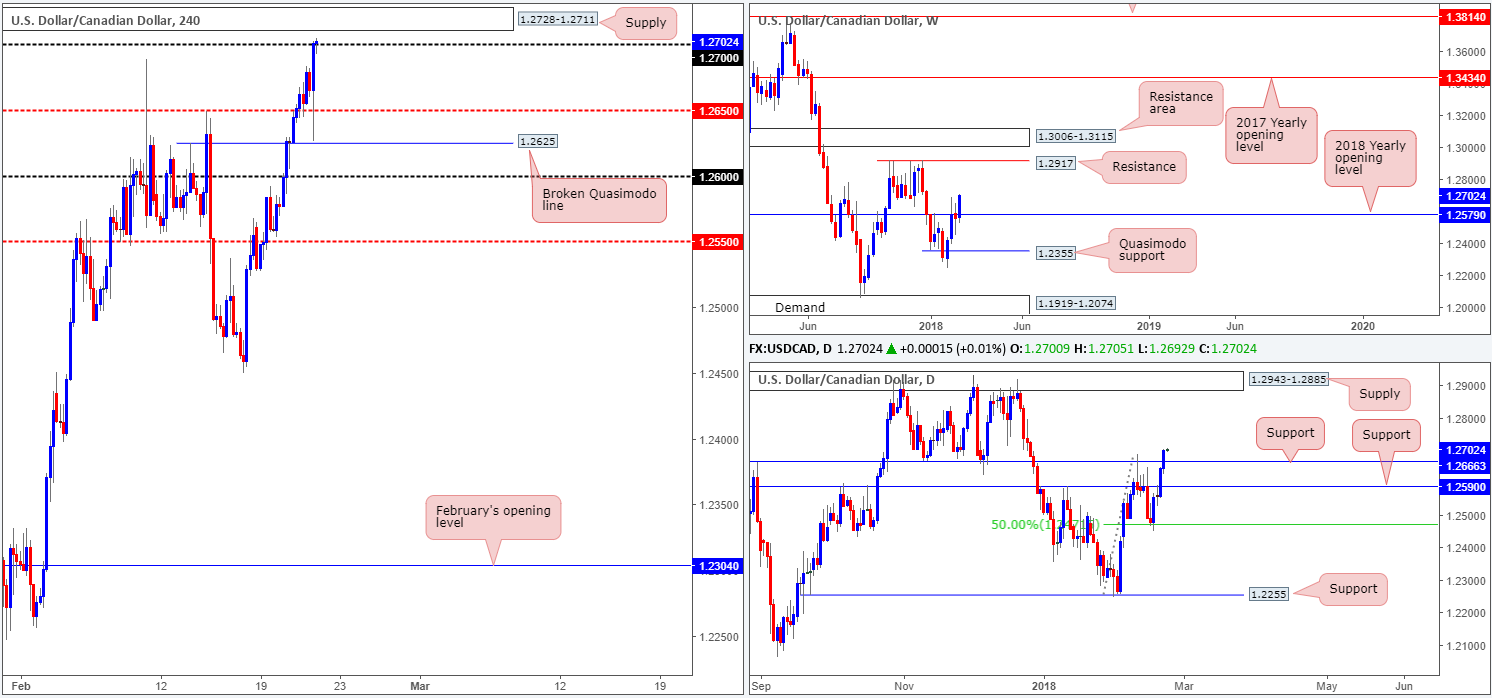
This has pulled the USD/CAD up to the 1.27 handle, which is shadowed closely by a fresh H4 supply base coming in at 1.2728-1.2711. Stop-loss orders above 1.27 are likely being filled, as we write. This, from an order-flow perspective, may provide traders with big pockets the liquidity required to short from the above said H4 supply.
However, before we go looking to short this area, traders may want to note that weekly price is trading firm above the 2018 yearly opening level at 1.2579 and shows room to rally as far north as the weekly resistance at 1.2917. By the same token, daily movement also recently crossed above daily resistance at 1.2666 (now acting support) and shows room to advance up to a daily supply area at 1.2943-1.2885 (encases the noted weekly resistance level).
Potential trading zones:
Although the bigger picture suggests further upside could be on the cards, an intraday short from the current supply is still of interest. Personally though, we would target any lower than the daily support level mentioned above at 1.2666.
Data points to consider: FOMC member Quarles speaks at 5.15am; US unemployment claims at 1.30pm; FOMC member Bostic speaks at 5.10pm; Canadian retail sales at 1.30pm; Crude oil inventories at 4pm GMT.
Areas worthy of attention:
Supports: 1.2650; 1.2666; 1.2579.
Resistances: 1.27 handle; 1.2728-1.2711; 1.2917; 1.2943-1.2885.
USD/CHF:
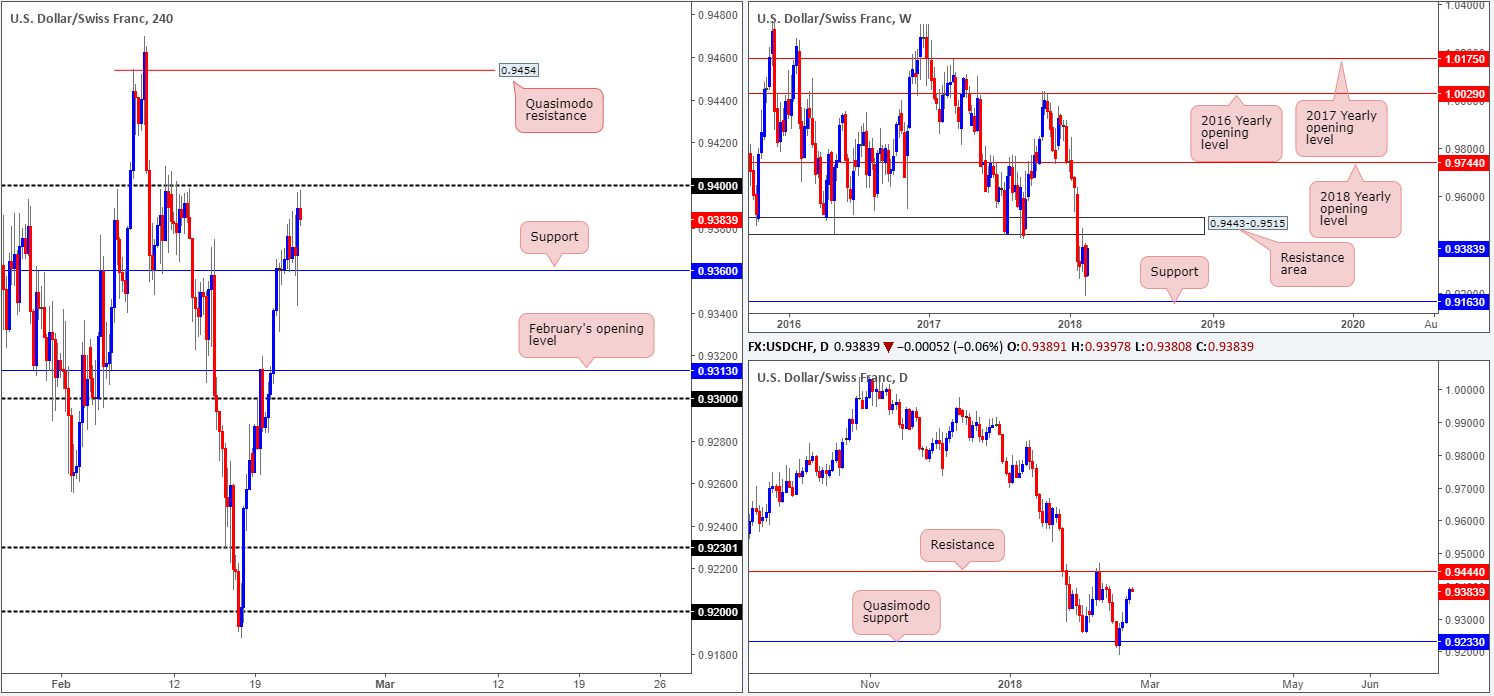
The bullish pulse continues to beat in the USD/CHF market, following a push up to highs of 0.9396.
According to H4 structure, the pair is mildly paring losses ahead of the 0.94 handle. This is something technical traders were likely expecting given the reaction seen off this number a few weeks back. A decisive push above this number will likely set the stage for a continuation move north up to the H4 Quasimodo resistance coming in at 0.9454.
Weekly price, on the other hand, shows that the unit is trading within striking distance of a major weekly resistance area coming in at 0.9443-0.9515. This is also emphasized on the daily chart in the form of a daily resistance level plotted at 0.9444 (which essentially represents the underside of the noted weekly zone).
Potential trading zones
In view of both weekly and daily action showing room to advance north, waiting for H4 price to CLOSE above 0.96 appears to be the logical route today. A decisive push above this number that’s followed up with a retest in the shape of a full or near-full-bodied H4 bull candle would, in our technical book, be enough to validate an intraday long position, targeting the daily resistance level mentioned above at 0.9444/H4 Quasimodo resistance at 0.9454.
Data points to consider: FOMC member Quarles speaks at 5.15am; US unemployment claims at 1.30pm; FOMC member Bostic speaks at 5.10pm GMT.
Areas worthy of attention:
Supports: 0.9360.
Resistances: 0.94 handle; 0.9444; 0.9443-0.9515.
DOW 30:
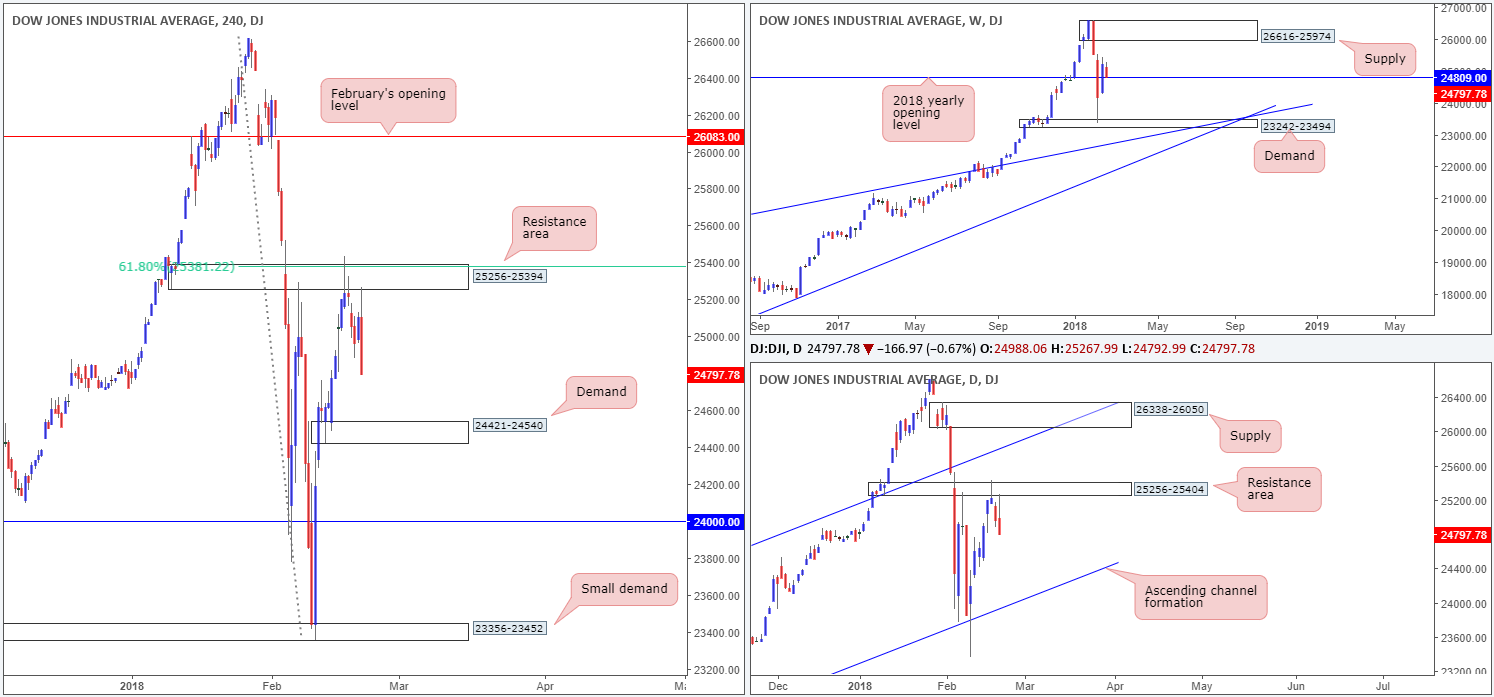
US equities posted a second consecutive daily loss on Wednesday, down 0.67%. The catalyst behind the recent turn lower was the latest Fed meeting minutes. The initial reaction prompted a round a buying, but price was quickly stopped in its tracks after connecting with the underside of the H4 resistance area noted at 25256-25394. In the event that the bears continue to push lower from here, the next area of interest on the H4 scale falls in at a H4 demand zone drawn from 24421-24540.
Weekly price, thanks to yesterday’s selloff, closed the day marginally back below the 2018 yearly opening level positioned at 24809. Daily flow, on the other hand, shows that price reacted to the underside of a daily resistance area at 25256-25404 (encases the noted H4 resistance zone). Continued selling from this point could drag prices down as far south as a daily channel support extended from the low 17883.
Potential trading zones:
Despite the 2018 yearly opening level still in motion, we would be hesitant buyers in this market! Entering long when both H4 and daily action show free downside is not something our team would label a high-probability setup! Unfortunately, the same goes for selling. Shorting into a weekly support band is just not our cup of tea! Therefore, remaining on the sidelines may be the better path to take at this time.
Data points to consider: FOMC member Quarles speaks at 5.15am; US unemployment claims at 1.30pm; FOMC member Bostic speaks at 5.10pm GMT.
Areas worthy of attention:
Supports: 24421-24540; 23242-23494; 24809.
Resistances: 25256-25394; 25381; 26616-25974; 25256-25404.
GOLD:
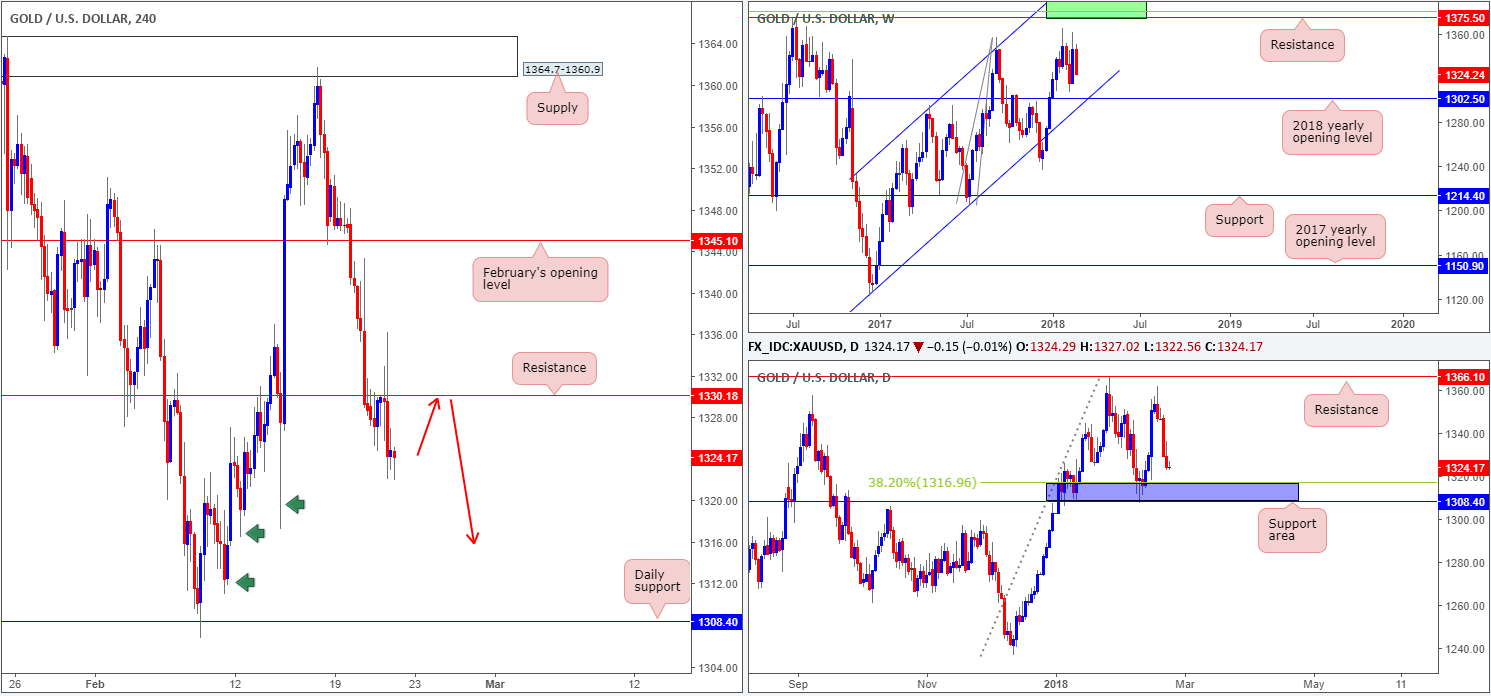
In recent movement, the gold market suffered an additional blow to the mid-section after dropping $5 in value, or 0.23%. The H4 resistance at 1330.1, despite attracting a monstrous whipsaw to highs of 1336.2 (FOMC meet), remained in the game and eventually pushed the metal to session lows of 1322.5.
With 1330.1 holding firm as resistance, we do not see a whole lot stopping the H4 candles from driving as far south as the daily support level coming in at 1308.4. The green arrows marked on the H4 chart resemble consumption tails. Our rationale behind this is simply that unfilled buy orders were triggered prior to price lifting higher; therefore when price returns to this location, downside should theoretically be reasonably free.
However, the other key thing to note here is that although H4 action shows free downside to the noted daily support, daily movement also has a 38.2% daily Fib support painted at 1316.9 (along with the daily support, forms a blue support zone), so one should expect some buying pressure to be seen around this point.
Potential trading zones:
Should the H4 candles retest the H4 resistance again today and hold firm in the shape of a full or near-full-bodied bearish formation, then a sell from here could be something to consider. As for take-profit targets, the first port of call, in our view, would be the daily 38.2% Fib noted above, and then the daily support at 1308.4.
Areas worthy of attention:
Supports: 1308.4/1316.9.
Resistances: 1330.1.
This site has been designed for informational and educational purposes only and does not constitute an offer to sell nor a solicitation of an offer to buy any products which may be referenced upon the site. The services and information provided through this site are for personal, non-commercial, educational use and display. IC Markets does not provide personal trading advice through this site and does not represent that the products or services discussed are suitable for any trader. Traders are advised not to rely on any information contained in the site in the process of making a fully informed decision.
This site may include market analysis. All ideas, opinions, and/or forecasts, expressed or implied herein, information, charts or examples contained in the lessons, are for informational and educational purposes only and should not be construed as a recommendation to invest, trade, and/or speculate in the markets. Any trades, and/or speculations made in light of the ideas, opinions, and/or forecasts, expressed or implied herein, are committed at your own risk, financial or otherwise.
The use of the site is agreement that the site is for informational and educational purposes only and does not constitute advice in any form in the furtherance of any trade or trading decisions.
The accuracy, completeness and timeliness of the information contained on this site cannot be guaranteed. IC Markets does not warranty, guarantee or make any representations, or assume any liability with regard to financial results based on the use of the information in the site.
News, views, opinions, recommendations and other information obtained from sources outside of www.icmarkets.com.au, used in this site are believed to be reliable, but we cannot guarantee their accuracy or completeness. All such information is subject to change at any time without notice. IC Markets assumes no responsibility for the content of any linked site. The fact that such links may exist does not indicate approval or endorsement of any material contained on any linked site.
IC Markets is not liable for any harm caused by the transmission, through accessing the services or information on this site, of a computer virus, or other computer code or programming device that might be used to access, delete, damage, disable, disrupt or otherwise impede in any manner, the operation of the site or of any user’s software, hardware, data or property.
