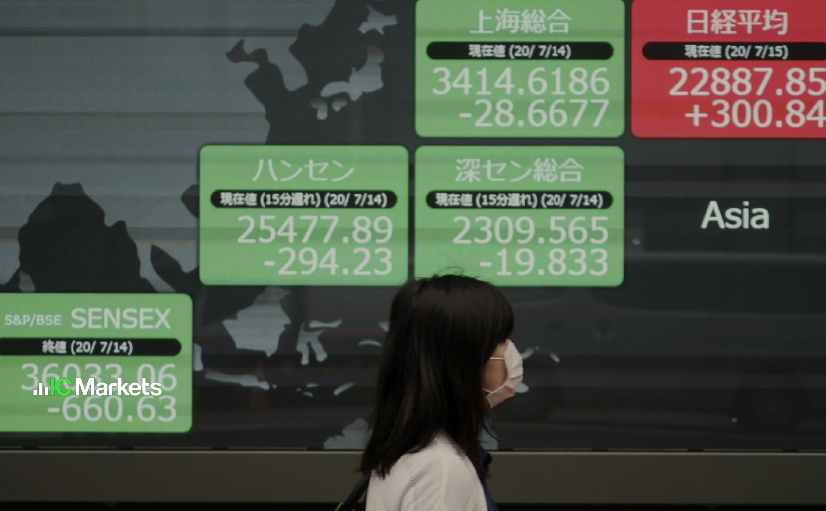
Tuesday 17th January 2023 : Technical Outlook and Review
USD/JPY: Looking at the Daily chart, my overall bias for USDJPY […]

Friday 13th January 2023 : Technical Outlook and Review
USD/JPY: Looking at the H4 chart, my overall bias for USDJPY […]

Friday 13th January 2023 : Asian markets trading end the second week of the year on positive note
Global Markets: News & Data: Markets Update: Asian stock markets are […]

Thursday 12th January 2023 : Technical Outlook and Review
ooking at the H4 chart, my overall bias for S&P500 is bullish due to the current price being above the Ichimoku cloud, indicating a bullish market. If this bullish momentum continues, expect the price to continue heading towards the 1st resistance at 4100.51, where the previous high is.

Wednesday 11th January 2023 : Hong Kong markets touch 6 month highs
Global Markets: News & Data: Markets Update: Asian stock markets are […]

Wednesday 11th January 2023 : Technical Outlook and Review
Looking at the H4 chart, my overall bias for S&P500 is bearish due to the current price being below the Ichimoku cloud, indicating a bearish market. If this bearish momentum continues, expect the price to continue heading towards the 1st support at 3764.49, where the recent low is.

Tuesday 10th January 2023:Asian Markets trade lower on global cues
Global Markets: News & Data: Markets Update: Asian stocks ended on […]

Tuesday 10th January 2023 Technical Outlook and Review
Looking at the H4 chart, my overall bias for USDJPY is bearish due to the current price being below the Ichimoku cloud, indicating a bearish market. If this bearish momentum continues, expect price to possibly break the 1st support at 131.683, where the 61.8% Fibonacci line is, before heading towards the 2nd support at 129.504, where the previous swing low is.

Monday 9th January 2023 : Technical Outlook and Review
Looking at the H4 chart, my overall bias for S&P500 is bearish due to the current price being below the Ichimoku cloud, indicating a bearish market. If this bearish momentum continues, expect the price to continue heading towards the 1st support at 3742.78, where the 61.8% Fibonacci line is.


