IC Markets Asia Fundamental Forecast | 09 January 2023
What happened in the US session? The DXY traded significantly lower […]

Friday 06th January 2023 : Technical Outlook and Review
Looking at the H4 chart, my overall bias for S&P500 is bearish due to the current price being below the Ichimoku cloud, indicating a bearish market. If this bearish momentum continues, expect the price to continue heading towards the 1st support at 3742.78, where the 61.8% Fibonacci line is.

Thursday 05th January 2023 : Asian Markets higher on signs of lower Fed hikes
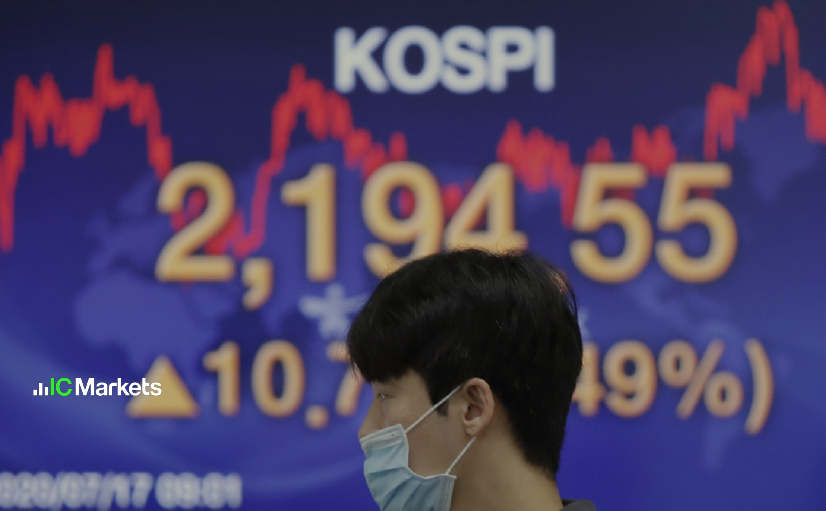
Global Markets: News & Data: Markets Update: Most Asian stock markets […]

Thursday 05th January 2023 : Technical Outlook and Review
Looking at the H4 chart, my overall bias for S&P500 is bearish due to the current price being below the Ichimoku cloud, indicating a bearish market. If this bearish momentum continues, expect the price to continue heading towards the 1st support at 3636.87, where the 78.6% Fibonacci line is.

Wednesday 4th January 2023 : Bond traders price in rate cuts despite Fed rhetoric
Global Markets: News & Data: Markets Update: Asian stocks rose broadly […]

Wednesday 4th January 2023 : Technical Outlook and Review
Looking at the H4 chart, my overall bias for S&P500 is bearish due to the current price being below the Ichimoku cloud, indicating a bearish market. If this bearish momentum continues, expect the price to continue heading towards the 1st support at 3636.87, where the 78.6% Fibonacci line is.

Tuesday 03rd January 2023 : Technical Outlook and Review
Looking at the H4 chart, my overall bias for S&P500 is bearish due to the current price being below the Ichimoku cloud, indicating a bearish market. If this bearish momentum continues, expect the price to continue heading towards the 1st support at 3636.87, where the 78.6% Fibonacci line is.

Friday 30th December 2022: Technical Outlook and Review
Looking at the H4 chart, my overall bias for USDJPY is bearish due to the current price being below the Ichimoku cloud, indicating a bearish market. If this bearish momentum continues, expect price to possibly continue heading towards the 1st support at 130.563, where the previous swing low is.

Thursday 29th December 2022: Technical Outlook and Review
Looking at the H4 chart, my overall bias for S&P500 is bearish due to the current price being below the Ichimoku cloud, indicating a bearish market. If this bearish momentum continues, expect the price to continue heading towards the 1st support at 3636.87, where the 78.6% Fibonacci line is.


