EUR/USD:
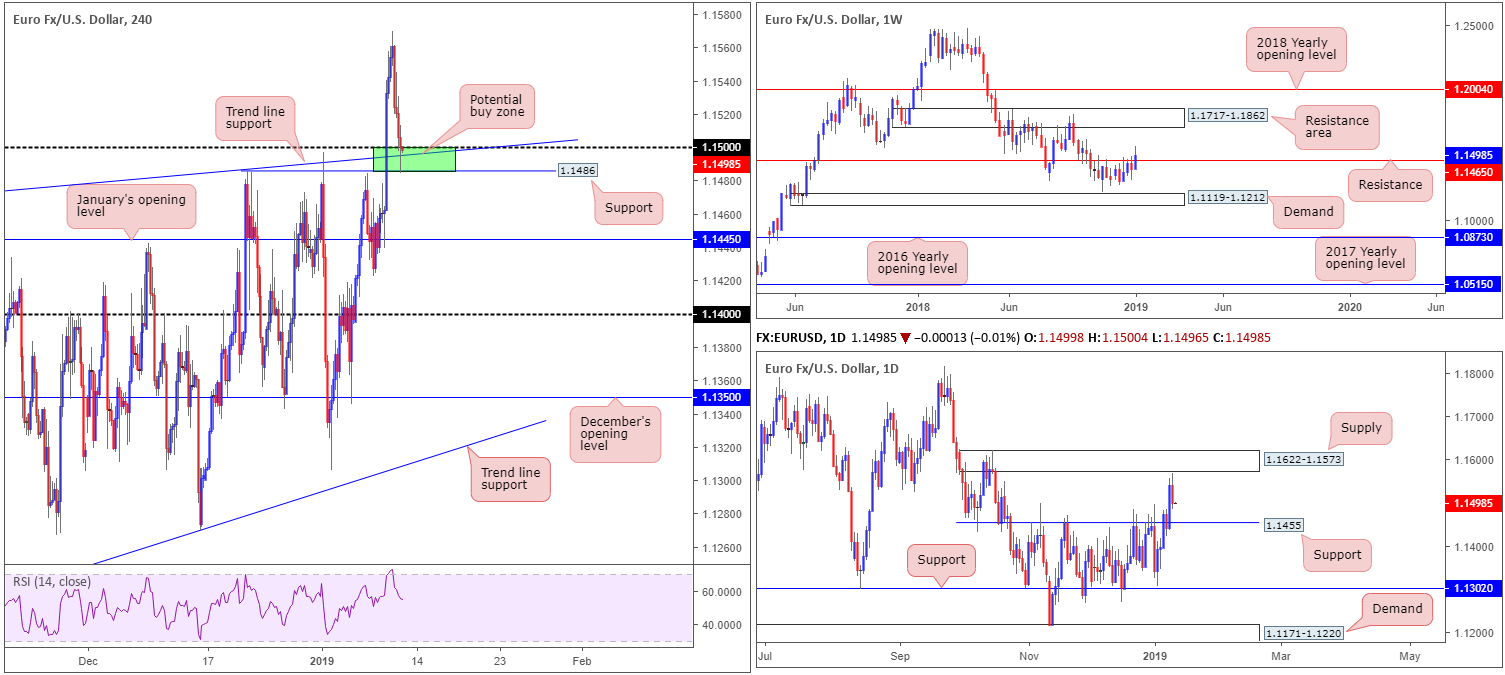
The single currency, as you can see, witnessed a sharp change in mood Thursday after tapping highs of 1.1569 in early Asia. The euro retreated lower from the said high as the US dollar (DXY) established support just ahead of its 95.00 mark as well as off the top edge of a monthly supply-turned support area at 95.13-92.75.
This tugged the EUR/USD H4 candles to 1.15, which happens to hold additional support in the form of a trend line (extended from the high 1.1472 and a Quasimodo resistance-turned support at 1.1486. In the event we push for lower ground beyond here today, January’s opening level at 1.1445 is next in the firing range, followed by 1.14.
The vibe on the bigger picture remains somewhat mixed. Weekly flow recently plowed through resistance linked at 1.1465, consequently exposing a resistance area coming in at 1.1717-1.1862. In terms of daily action, supply at 1.1622-1.1573 came within inches of entering the fold yesterday before the market turned for lower levels. The next area of interest to the downside on this scale falls in around support seen at 1.1455 (aligns closely with January’s opening level mentioned above on the H4 timeframe at 1.1445).
Areas of consideration:
Following the unit’s recent higher high formation, the short-term outlook on the H4 timeframe bodes well for traders looking to buy this pair from 1.1486/1.15 (green). Given the conflicting signals we’re receiving from the higher timeframes, however, traders are urged to consider waiting for additional confirmation to form before pulling the trigger. A confirming bullish candlestick formation, for example, would be ideal. This not only offers traders a defined entry and exit point, it also shows whether or not buyers are active.
In regards to targets out of 1.1486/1.15, look for yesterday’s high at 1.1569 – essentially shoot for the underside of daily supply highlighted above at 1.1622-1.1573.
Today’s data points: US CPI m/m and US Core CPI m/m.
GBP/USD:
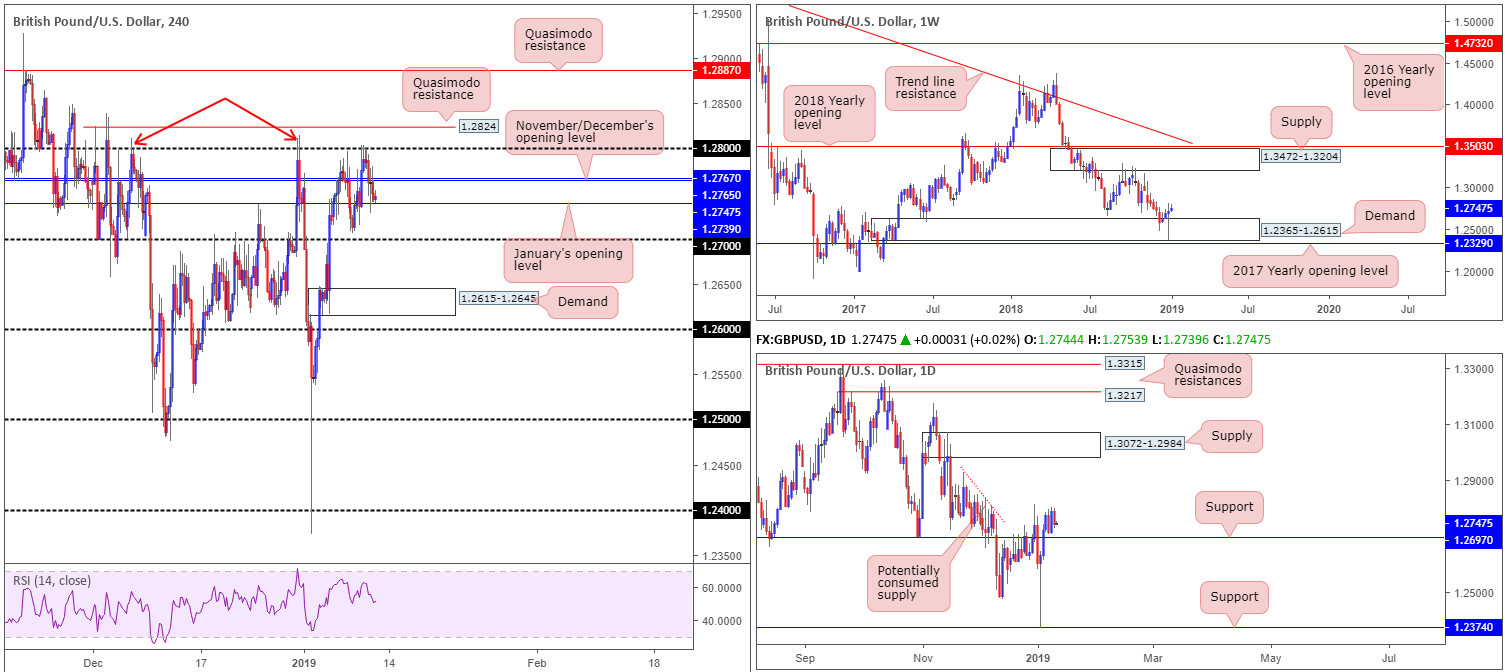
The GBP/USD spent Thursday visiting familiar levels, shedding ground off 1.28 and reclaiming November and December’s opening levels at 1.2767/65 on the H4 timeframe to the downside. Down 0.34%, the pair concluded the day testing January’s opening level at 1.2739. A failure of this barrier will likely clear the runway south to 1.27.
Speculative interest remains somewhat lackluster in this market ahead of the key Parliamentary vote on UK PM May’s Brexit deal next week. On the data front in the meantime, however, the UK releases manufacturing and Industrial Production data today, along with important growth figures, all regarded as high impact on the economic calendar.
From the perspective of the higher timeframes, both weekly and daily charts display signs of further upside materializing over the coming weeks. Cable firmly entered the parapets of weekly demand at 1.2365-1.2615 in the opening stages of the year, challenging the lower borders of the area before finding willing buyers and pushing higher. Assuming buyers remain defensive, a run towards supply painted at 1.3472-1.3204 may be in store over the coming weeks. In conjunction with weekly movement, daily activity concluded recent trade closing above resistance priced in at 1.2697 (now acting support). Continued buying from this point could lead to a test of supply at 1.3072-1.2984. Above 1.2697, limited supply is visible, with a major portion of orders likely consumed as price declined lower in late November of 2018 (see red descending line).
Areas of consideration:
While higher-timeframe structure indicates further upside, the short-term outlook is capped by a stubborn 1.28 psychological level. The research team notes the H4 timeframe is still an attractive chart for intraday shorts off the Quasimodo resistance at 1.2824. This level is perfectly positioned to facilitate a stop run above not only the 1.28 handle, but also the two tops marked with red arrows at 1.2811 and 1.2815. In terms of stop placement for a sell out of 1.2824, above the Quasimodo apex is a possibility at 1.2839. As for take-profit targets, November and December’s opening levels at 1.2767/65 are logical starting points should the unit overcome 1.28 (could potentially act as support).
In the event we overthrow 1.2824 as a sell zone, as the higher timeframes suggest, traders’ crosshairs will likely be pinned on another layer of Quasimodo resistance at 1.2887. A H4 close above 1.2824, therefore, followed up with a retest by way of a bullish candlestick formation (entry/stop parameters can be defined according to this pattern) would be considered a high-probability long, targeting 1.2887 as the initial upside target.
Today’s data points: UK GDP m/m; UK Manufacturing Production m/m; US CPI m/m and US Core CPI m/m.
AUD/USD:
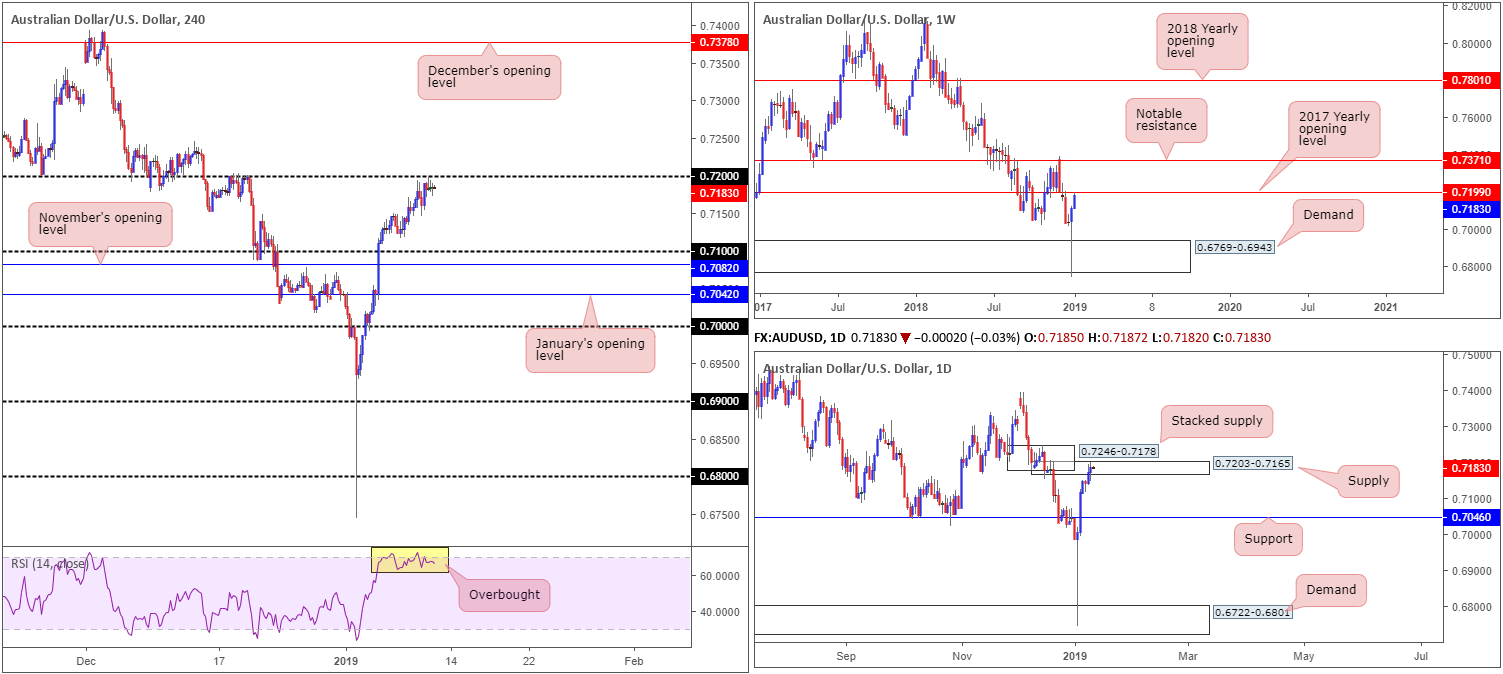
Kicking this morning’s report off with a look at the weekly timeframe, the research team notes price action came within a pip of connecting with its 2017 yearly opening level at 0.7199 Thursday. Although we expect a bounce lower from here, traders still need to prepare for the possibility of a run above this level towards notable resistance standing at 0.7371.
Encapsulating the 2017 yearly opening level mentioned above at 0.7199 is a daily supply zone printed at 0.7203-0.7165. Note this area boasts strong momentum to the downside out of its base, indicating strength. It might also be worth noting we have another layer of supply directly above (stacked supply) at 0.7246-0.7178.
A closer reading of this market pulls in the H4 candles which currently hover just south of its 0.72 handle. 0.72 remains a critical level in this market, according to our analysis. Besides the H4 RSI offering a confirming overbought reading, 0.72 also represents the 2017 yearly opening level at 0.7199 on the weekly timeframe. Further adding to this, traders may also want to acknowledge daily supply around 0.7203-0.7165 currently in play.
Areas of consideration:
0.72 is a key level in this market for potential shorts. As round numbers are prone to stop runs/fakeouts, however, traders are urged to consider waiting for additional confirmation to form before pulling the trigger. A bearish candlestick pattern, for example, not only identifies seller interest, it also offers structure that defines entry and stop parameters.
In terms of downside targets from 0.72, the 0.71 handle appears logical, thus providing traders ample room to secure reasonable risk/reward.
Today’s data points: US CPI m/m and US Core CPI m/m.
USD/JPY:
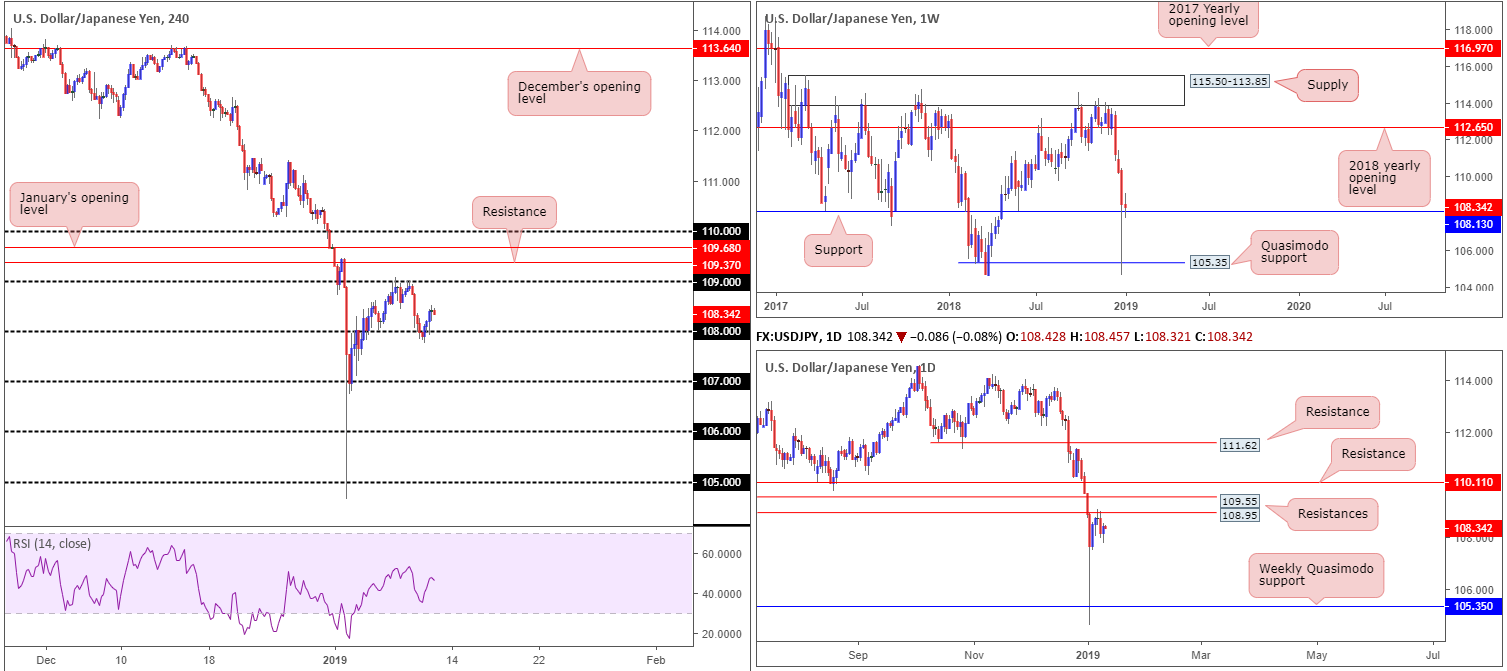
Broad-based USD buying (DXY) took shape Thursday just ahead of its 95.00 mark and off the top edge of a monthly supply-turned support area at 95.13-92.75. This reinforced the USD/JPY market, consequently reclaiming a portion of Wednesday’s losses.
The 108 handle sited on the H4 timeframe, as you can see, remained tough. For those who follow a multi-timeframe methodology, you’ll have likely observed additional weekly support around this zone coming in from 108.13. Think of this level as 108’s bigger brother.
Assuming buyers remain in the driving seat today, the next pit stop falls in around 109. Note this level houses additional support from daily resistance at 108.95 (a Quasimodo support-turned resistance). Directly above 109, it might also be worth penciling in H4 resistance at 109.37, tailed closely by January’s opening level at 109.68. In between these two levels sits another layer of daily resistance (also a Quasimodo support-turned resistance) at 109.55.
Areas of consideration:
Having seen weekly price retest support at 108.13 and daily price establish a ceiling off 108.95, there’s clearly a competing theme present on the bigger picture at the moment.
Despite this, traders are urged to keep eyes on the following levels for possible trades today:
- 108 on the H4 timeframe remains an area worthy of attention for longs, knowing it has a connection to weekly support at 108.13.
- 109 is also an attractive level for shorts, given it converges closely with daily resistance at 108.95.
Both of the above said levels are capable of bouncing price action, according to our technical studies. Though to help avoid an unnecessary loss, waiting for additional confirmation to take shape prior to pressing the execute button is recommended.
Today’s data points: US CPI m/m and US Core CPI m/m.
USD/CAD:
Trading volume remained relatively light amid Thursday’s sessions, despite a 0.20% gain.
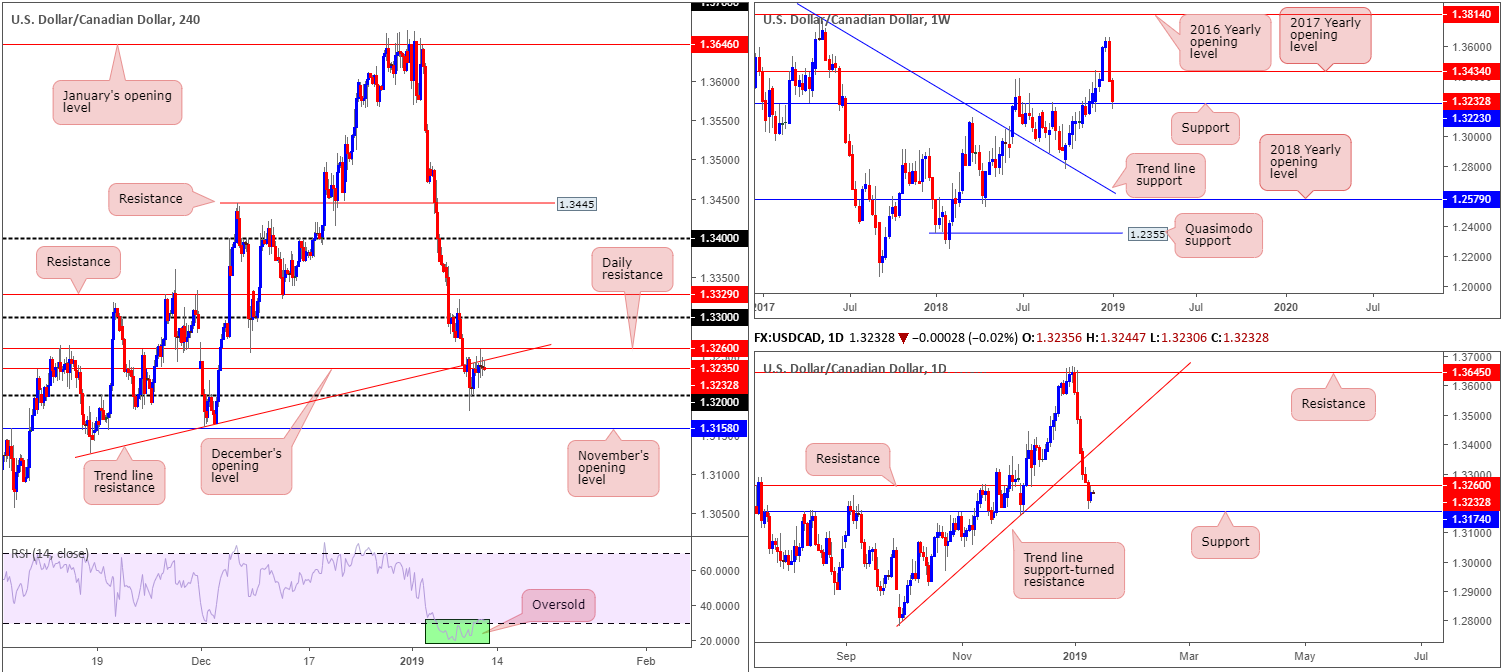
H4 price action, as you can see, is exceedingly limited at the moment. To the upside we have a trend line support-turned resistance (taken from the low 1.3127) in motion, bolstered by daily resistance plotted nearby at 1.3260. To the downside, however, the 1.32 handle is in view, as is December’s opening level at 1.3235.
In addition to the above, we also can see weekly support currently in play at 1.3223, which is likely helping H4 buyers remain afloat and defend its 1.32 region. Despite this, we do not see much of an opportunity to buy this market based on current structure. Not only do we have a H4 trend line resistance in view and a daily resistance level (highlighted above), there’s potential resistance from 1.33 to contend with as well.
Irrespective of the direction traders select today, opposing structure is clearly evident in this market, therefore making it a challenging pair to trade.
Areas of consideration:
Based on the above reading, the research team has labelled this market as flat: neither a long nor short appears attractive at the moment
Today’s data points: US CPI m/m and US Core CPI m/m.
USD/CHF:
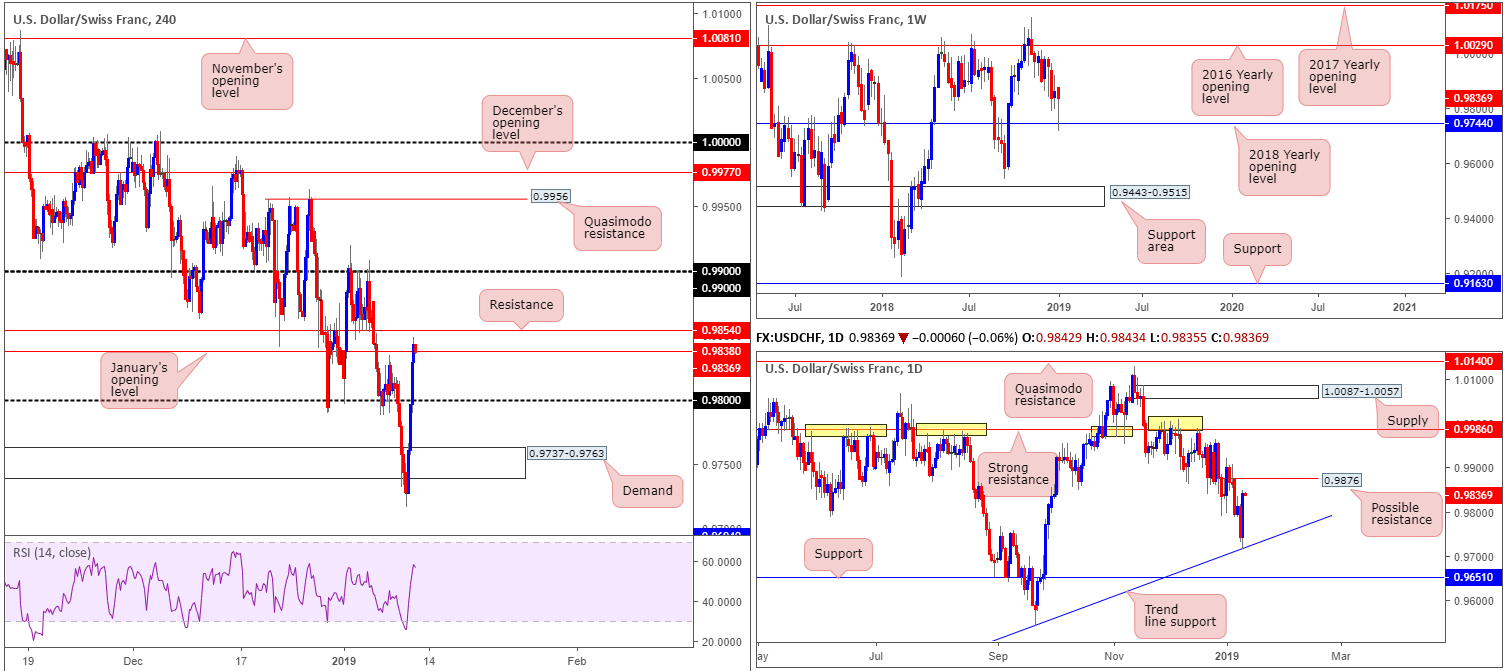
A USD correction against European currencies helped bolster the USD/CHF during Thursday’s sessions. Technically speaking, a number of buyers also likely entered the market based on support emerging from the weekly timeframe in the shape of a 2018 yearly opening level at 0.9744. This level, as you can see on the daily timeframe, is also reinforced by a trend line support (extended from the low 0.9187).
The next higher-timeframe resistance to be watchful of falls in around 0.9876 on the daily timeframe. This, we believe, is the last line of resistance until we’re free to test the notable barrier priced in at 0.9986.
Thursday’s movement on the H4 scale lifted the candles beyond its 0.98 handle and eventually above January’s opening level at 0.9838. However, it may be worth noting price action is, at the time of writing, crossing back beneath this monthly open level, leaving nearby resistance at 0.9854 unchallenged.
Areas of consideration:
According to our technical studies on the higher timeframes, further buying could be on the horizon until reaching daily resistance plotted at 0.9876.
Having seen the H4 candles hovering beneath resistance at 0.9854, buying this market is tricky, despite the current weekly support (see above). Beyond 0.9854 we have little more than 20 pips to work with until shaking hands with daily resistance at 0.9876.
On account of the above, neither a long nor short appears worthy today. Both ends seem restricted.
Today’s data points: US CPI m/m and US Core CPI m/m.
Dow Jones Industrial Average:
US benchmarks concluded Thursday’s session higher, adding to the consecutive daily gains as investors continue to cheer prospects for a China/US trade solution, as well as also riding sentiment surrounding the Fed.
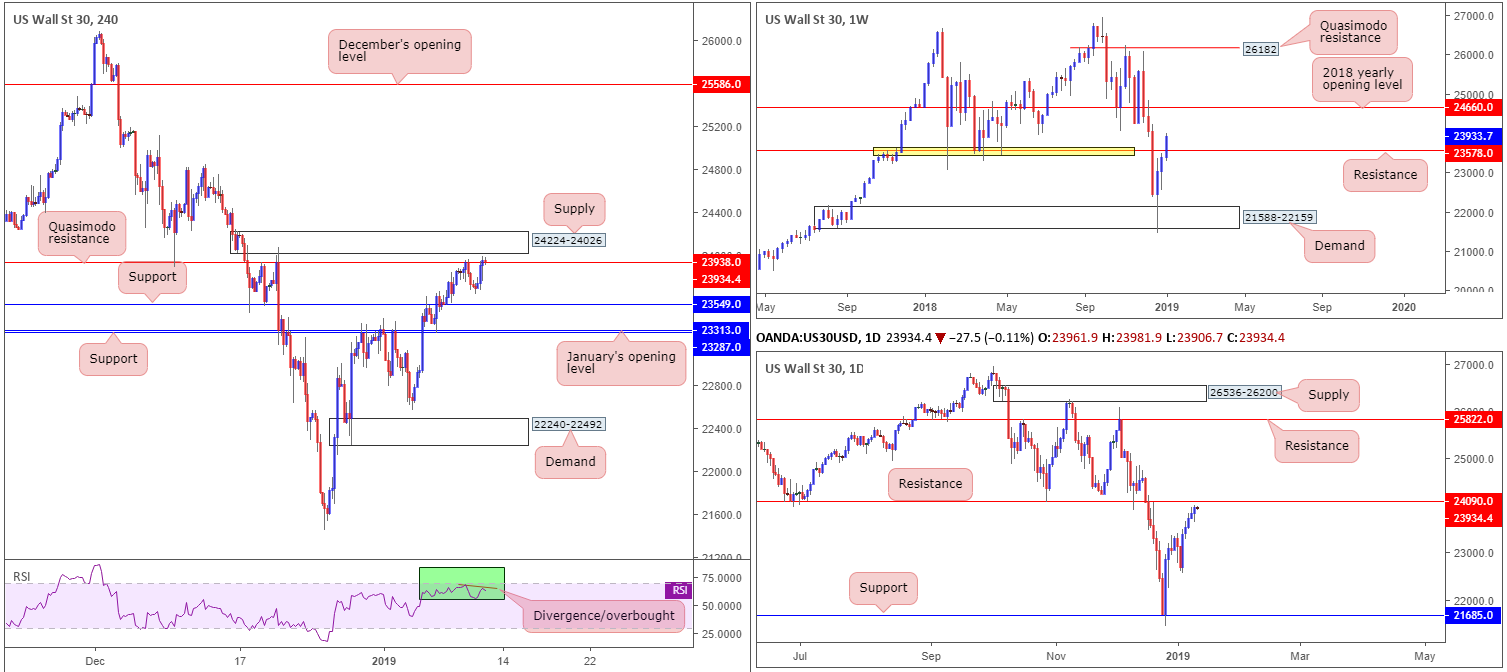
Against the backdrop of fundamental/political drivers, the technical picture reveals H4 action is attempting to reclaim a Quasimodo resistance at 23938, opening the possibility of a test of nearby supply at 24224-24026. It might also be worth noting the RSI indicator is seen printing a divergence/overbought reading.
Bringing forward the higher-timeframe picture, traders will note weekly price remains above resistance at 23578, eyeing a possible run towards the 2018 yearly opening level at 24660. Daily flow, on the contrary, is poised to attack nearby resistance drawn from 24090. Note this level boasts reasonably strong historical meaning. As is evident from the charts, the current H4 supply area also actually houses the daily resistance level.
Areas of consideration:
For folks who read Wednesday’s briefing you may recall the piece highlighted a possible sell from either the current H4 resistance level at 23938, or the H4 supply seen overhead at 24224-24026. With H4 resistance suffering somewhat at the moment, eyes turn to the noted H4 supply zone for possible shorting opportunities (conservative traders may opt to wait and see if additional candlestick confirmation forms before pulling the trigger, given where the index is trading on the weekly timeframe).
Downside targets from this region fall in around H4 support at 23549, followed by H4 support at 23287/January’s opening level at 23313.
Today’s data points: US CPI m/m and US Core CPI m/m.
XAU/USD (Gold):
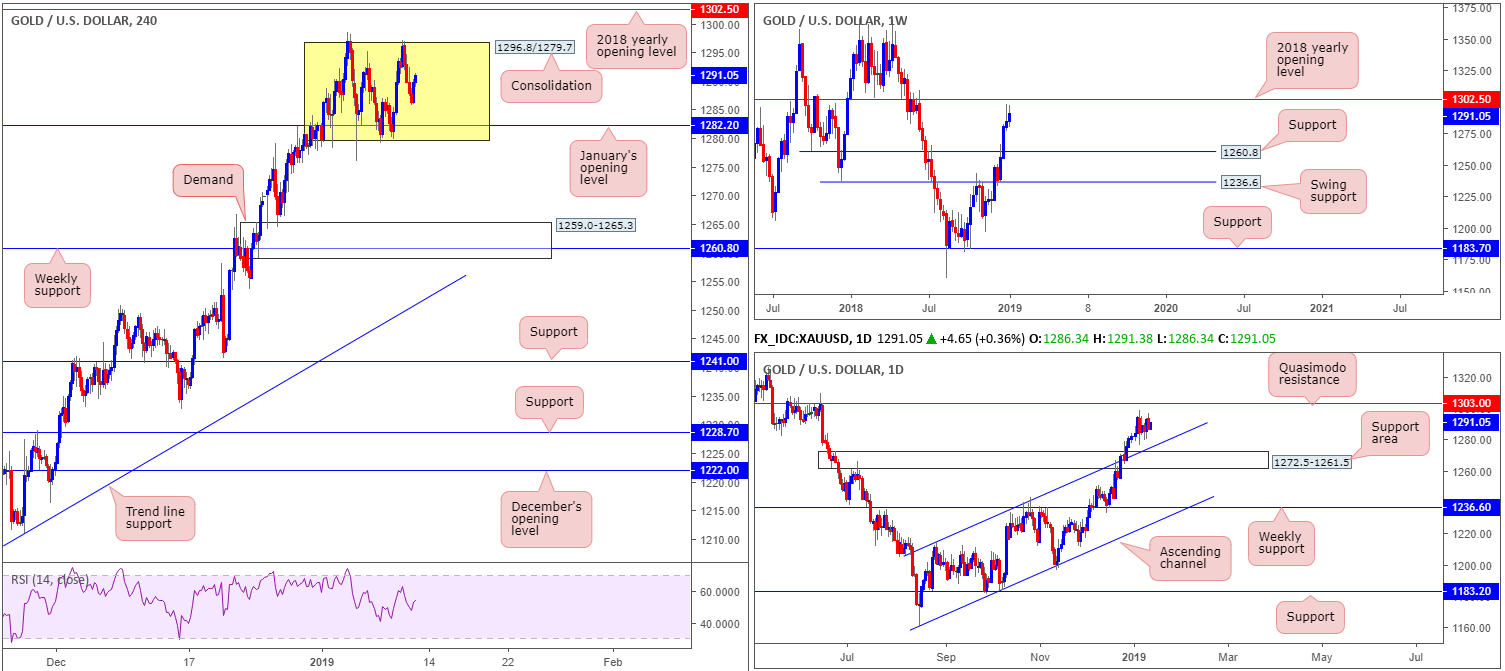
Since the beginning of the week, bullion has been busy carving out a consolidation (yellow) on the H4 timeframe between 1296.8/1279.7. Inside the lower limits of this range, traders may also want to note January’s opening level at 1282.2 is clearly visible.
Beneath the aforementioned H4 consolidation, the research team notes room for the sellers to stretch their legs towards H4 demand plotted at 1259.0-1265.3, which happens to fuse nicely with weekly support at 1260.8. Note this H4 demand is also sited within the lower limits of a daily support area coming in at 1272.5-1261.5. It might also be worth mentioning that before we reach the aforementioned H4 demand, daily buyers may try to defend the channel resistance-turned support (etched from the high 1214.3).
Above the current H4 range, however, we have the 2018 yearly opening level positioned nearby at 1302.5 (weekly timeframe), shadowed closely by a daily Quasimodo resistance at 1303.0.
Areas of consideration:
Range traders may look to trade the limits of the aforesaid H4 range today, using additional confirmation to confirm whether active buyers/sellers are present around the edges of this formation.
Given the recent strength of gold over the past couple of weeks, though, a break of this range to the upside is possible. Should this come to fruition, traders’ crosshairs will likely be fixed on the 2018 yearly opening level mentioned above at 1302.5/daily Quasimodo resistance for shorts. This may be something for next week, as the range will likely remain in play today.
The use of the site is agreement that the site is for informational and educational purposes only and does not constitute advice in any form in the furtherance of any trade or trading decisions.
The accuracy, completeness and timeliness of the information contained on this site cannot be guaranteed. IC Markets does not warranty, guarantee or make any representations, or assume any liability with regard to financial results based on the use of the information in the site.
News, views, opinions, recommendations and other information obtained from sources outside of www.icmarkets.com.au, used in this site are believed to be reliable, but we cannot guarantee their accuracy or completeness. All such information is subject to change at any time without notice. IC Markets assumes no responsibility for the content of any linked site. The fact that such links may exist does not indicate approval or endorsement of any material contained on any linked site.
IC Markets is not liable for any harm caused by the transmission, through accessing the services or information on this site, of a computer virus, or other computer code or programming device that might be used to access, delete, damage, disable, disrupt or otherwise impede in any manner, the operation of the site or of any user’s software, hardware, data or property.


