EUR/USD:
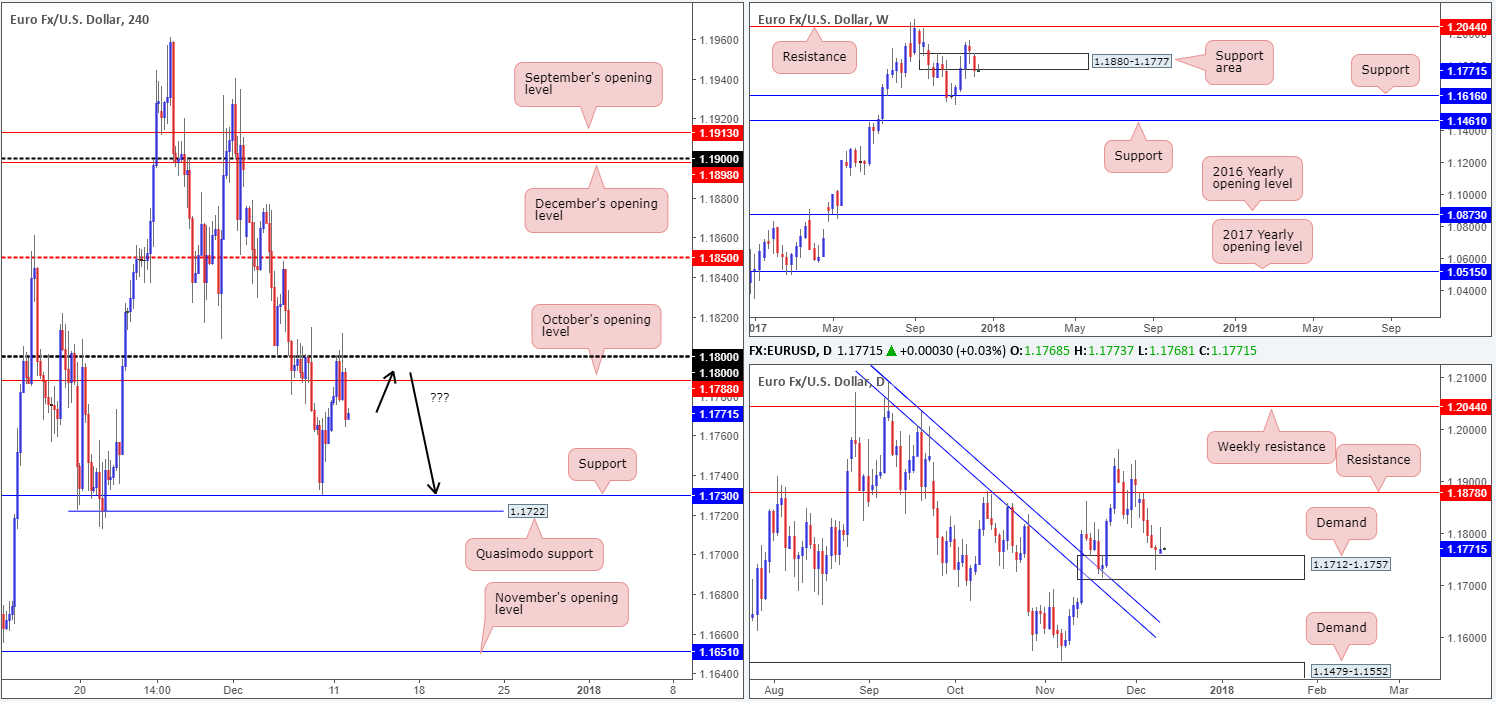
Try as it might, the single currency was incapable of breaching the 1.18 handle on Monday, despite a lower-than-expected US JOLTS. As you can see, the day ended with H4 price printing a near-full-bodied bearish H4 candle beneath October’s opening level at 1.1788, with eyes now likely on the H4 support level coming in at 1.1730.
Over on the weekly timeframe, price remains lurking a few pips beneath the weekly support area formed at 1.1880-1.1777. Potentially filling stop-loss orders here, we could either see a rotation back to the upside as bigger players look to buy into these orders or a continued move to the downside, targeting weekly support at 1.1616.
Friday’s daily buying tail (formed off a daily demand area at 1.1712-1.1757) failed to register much of a follow-through yesterday, thanks to a strongly defended round number on the H4 timeframe and potential selling interest on the weekly picture (Monday’s daily candle printed a mirror image of Friday’s daily action).
Direction:
• Long: Buying shows little promise. Not only is there feeble buying from the current daily demand and a potentially debilitated weekly support area, there’s also room for the H4 candles to drive as far south as H4 support mentioned above at 1.1730.
• Short: A sell on the retest of 1.18/1.1788 could be an option today, targeting 1.1730 (H4 timeframe). Be that as it may, this would entail shorting into daily demand! Therefore, trade with caution.
Data points to consider: German ZEW economic sentiment at 10am; ECB president Draghi speaks at 7pm; US PPI m/m at 1.30pm GMT.
Areas worthy of attention:
Supports: 1.1730; 1.1722; 1.1880-1.1777; 1.1712-1.1757.
Resistances: 1.1788; 1.18 handle.
GBP/USD:
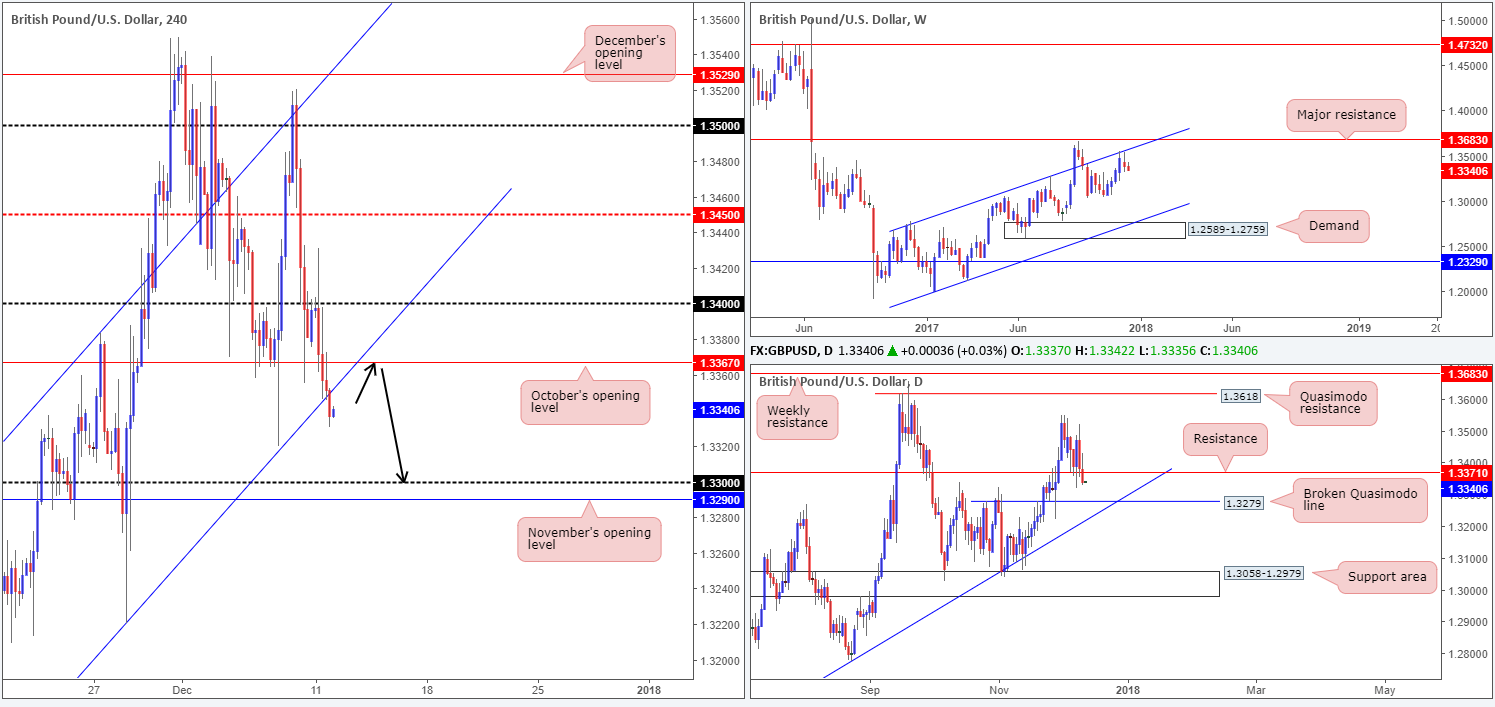
After failing to sustain gains beyond the 1.34 handle on Monday, the British pound suffered further losses as ‘Brexit’ talks weighed. As a result of this, October’s opening level seen on the H4 timeframe at 1.3367 was submerged, as was the H4 channel support etched from the low 1.3061 going into the last hours of the day. This means that the 1.33 handle and November’s opening level at 1.3290 could be brought into the spotlight today.
What this recent move also achieved was cracking through daily support at 1.3371 (now acting resistance). The next downside target on this scale is a nearby broken daily Quasimodo support at 1.3279 that’s positioned directly above a daily trendline support taken from the low 1.2108.
From a technical standpoint, we guess one could say that further downside was to be expected since weekly price is trading from a weekly channel resistance extended from the high 1.2673. Further selling from this area could ultimately see the pair cross paths with weekly demand at 1.2589-1.2759, which happens to intersect with a weekly channel support etched from the low 1.1986.
Direction:
• Long: Buying after a decisive break of daily/H4 structure, as well as selling pressure coming in from weekly structure is a risky move, as far as we can see. Everything currently points to the downside.
• Short: A sell on the retest of October’s opening level on the other hand (see black arrows) could be something to consider, given its relationship with daily resistance at 1.3371 (target objective at 1.33/1.3290, followed by the aforementioned daily broken Quasimodo line).
Data points to consider: UK inflation data at 9.30am; US PPI m/m at 1.30pm GMT.
Areas worthy of attention:
Supports: 1.33 handle; 1.3290; 1.3279; daily trendline support taken from the low 1.2108.
Resistances: 1.3367; 1.3371; weekly channel resistance taken from the high 1.2673; H4 channel resistance extended from the low 1.3061.
AUD/USD:
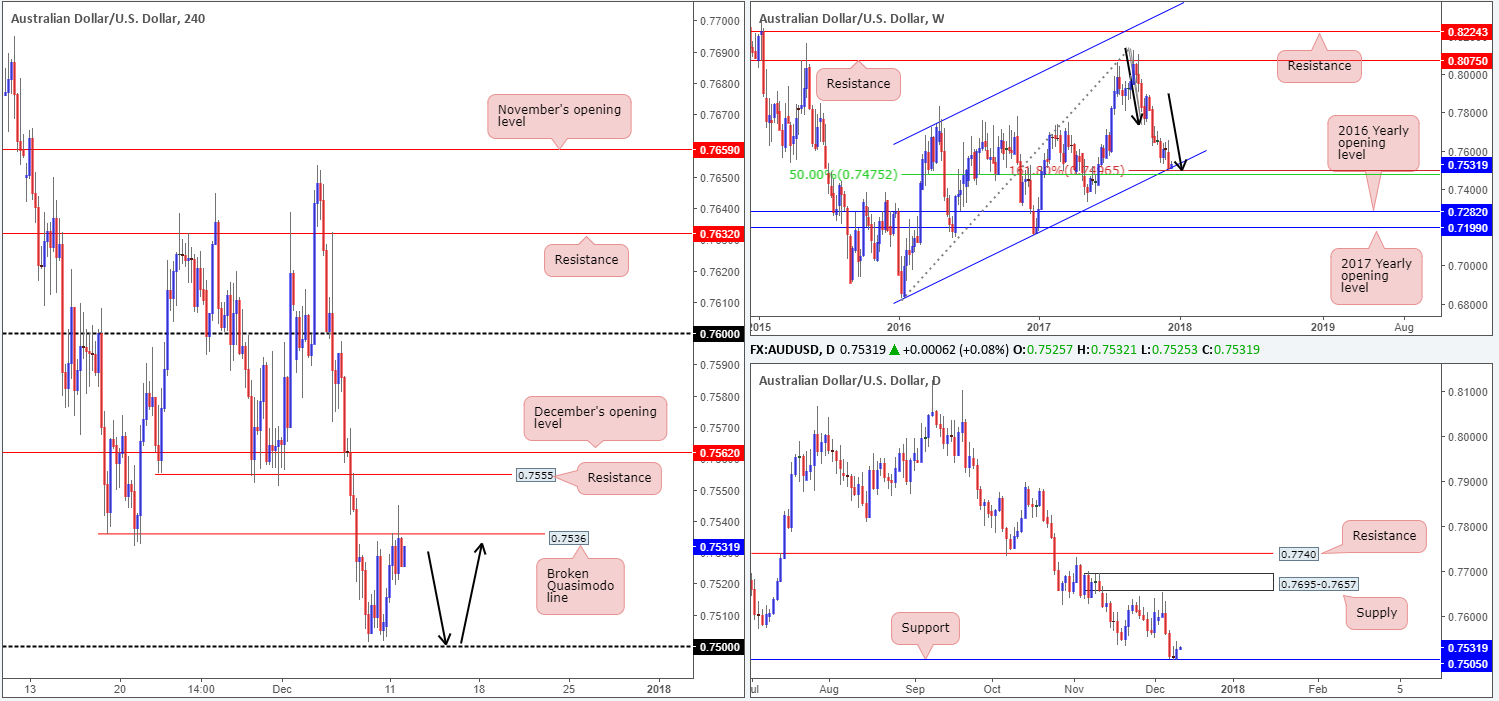
Leaving the 0.75 handle unchallenged, AUD/USD prices were bid on Monday, consequently rallying to highs of 0.7545. Although this saw H4 price pierce through a H4 broken Quasimodo line at 0.7536, likely filling a truckload of stop-loss orders in the process, the level remained intact going into the closing bell.
Through the lens of a technical trader, the recent upside move was likely due to the daily support at 0.7505 and the weekly channel support extended from the low 0.6827(merges closely with a weekly 50.0% value at 0.7475 taken from the high 0.8125, and a nice-looking weekly AB=CD [see black arrows] 161.8% Fib ext. point situated at 0.7496) currently in play.
Direction:
• Long: The 0.75 handle is still considered a strong buy zone given the higher-timeframe confluence surrounding the line. Therefore, should H4 price pullback from 0.7536 today, fake below Friday’s lows of 0.7502 and shake hands with 0.75, a strong rotation could be on the cards. In order to avoid any whipsaw that may be seen through 0.75, and considering that there will be likely higher-timeframe players involved here, a larger-than-usual stop may be required. Beyond the 0.7457 low seen back on the 06/06/17 (H4 timeframe) could be an option for stop-loss placement.
• Short: It’d be very risky to short into current structure, despite the downtrend in motion right now!
Data points to consider: RBA Gov. Lowe speaks at 10.15pm; US PPI m/m at 1.30pm GMT.
Areas worthy of attention:
Supports: 0.75 handle; weekly channel support extended from the low 0.6827; 07505; weekly AB=CD 161.8% Fib ext. point situated at 0.7496.
Resistances: 0.7555; 0.7536.
USD/JPY:
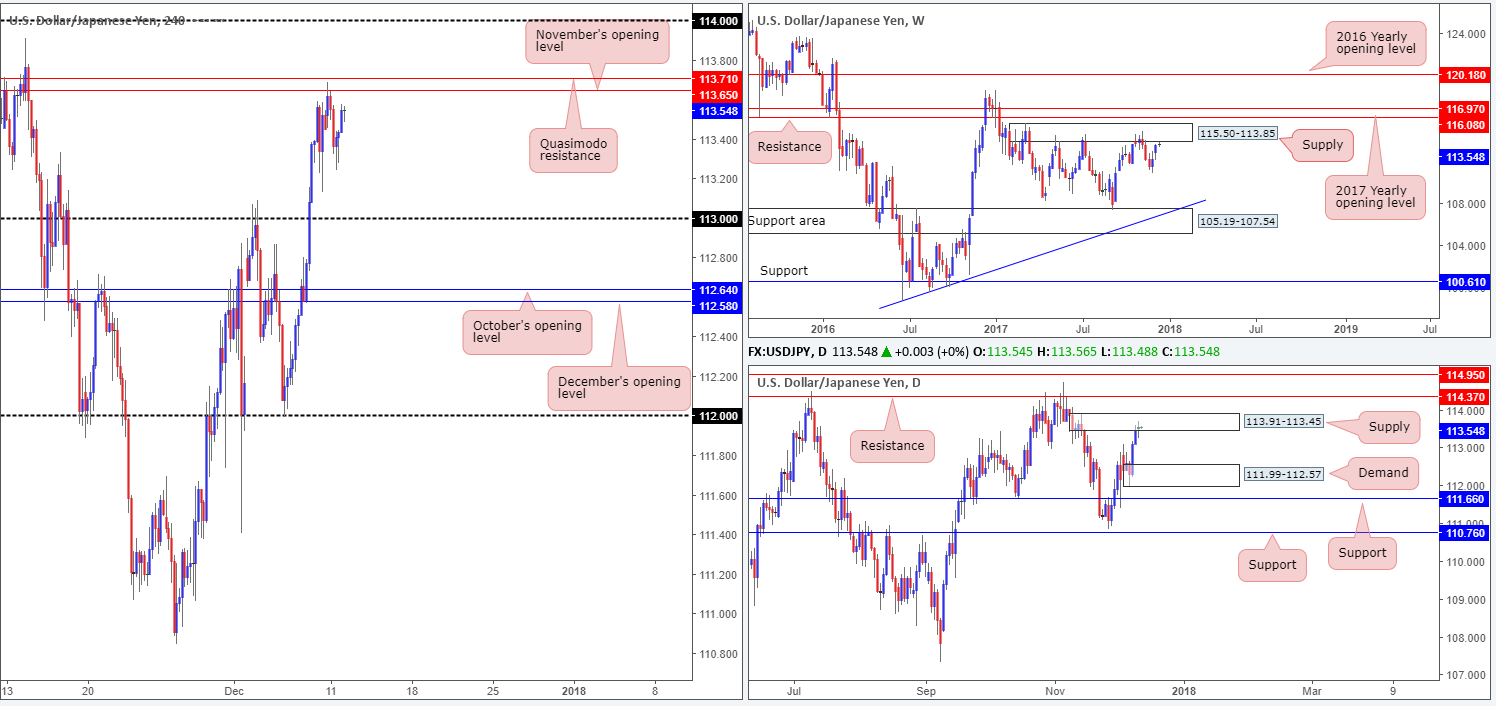
For those who read Monday’s report, you may recall that we highlighted 113.71/113.65 (H4 Quasimodo resistance/November’s opening line) as a potential sell zone on the H4 timeframe. As these two levels are drawn within the current daily supply zone sited at 113.91-113.45, and knowing that this daily supply is bolstered by a weekly supply fixed at 115.50-113.85, it was not surprising to see 113.71/113.65 hold firm yesterday. The move, as you can see from the H4 timeframe, produced a 44-pip selloff to lows of 113.24 before finding fresh bids and rotating north.
Direction:
• Long: It’d be very risky to buy into current structure, despite the latest swing north!
• Short: With H4 price seen hovering just beneath 113.71/113.65, a sell from here on a second test is interesting. The only problem, as highlighted in Monday’s report, is stop-loss placement. Setting stops above the current daily supply is appealing, but then you’re potentially opening yourself up to a fakeout up to the round number seen at 114! A healthy rotation from the H4 barriers, however, could still target the 113 handle and quite possibly the daily demand base seen at 111.99-112.57 (positioned nearby December/October’s opening levels on the H4 timeframe at 112.58/112.64).
Data points to consider: US PPI m/m at 1.30pm GMT.
Areas worthy of attention:
Supports: 113 handle.
Resistances: 113.65; 113.71; 114 handle; 113.91-113.45; 115.50-113.85.
USD/CAD:
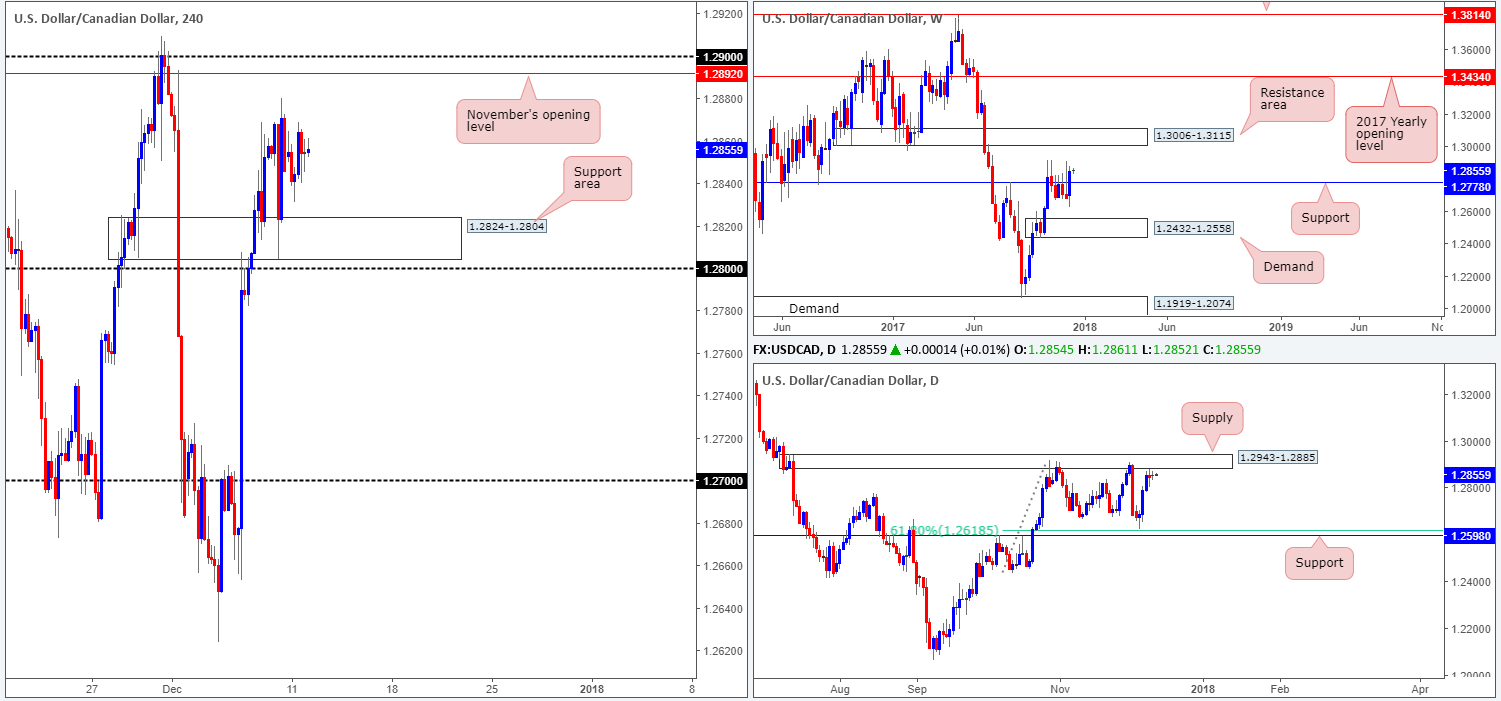
The USD/CAD is effectively little changed this morning.
On the H4 timeframe, we can see that we currently have November’s opening level at 1.2829, followed closely by the 1.29 handle defending upside. While to the downside there’s a H4 support area pegged at 1.2824-1.2804 in sight, positioned just above the 1.28 handle.
Elsewhere, weekly price firmly closed above weekly resistance at 1.2778 (acting support) last week, potentially clearing upside to a weekly resistance area coming in at 1.3006-1.3115. Stopping weekly buyers from pushing north, however, is a daily supply zone located at 1.2943-1.2885. This area has capped upside since late October, so there’s a good chance that we may see history repeat itself here.
Direction:
• Long: Buying is difficult. Yes, we have cleared a weekly resistance level, but in the process of doing so, a daily supply was brought into the fray!
• Short: Selling from 1.29/1.2892 could be an area to consider, as it is sited within daily supply and, therefore, allows one to position stops above the daily zone whilst shorting a H4 base. The only grumble here, of course, is weekly structure indicating further upside might be at hand.
Data points to consider: US PPI m/m at 1.30pm GMT.
Areas worthy of attention:
Supports: 1.2824-1.2804; 1.28 handle; 1.2778.
Resistances: 1.29 handle; 1.2892; 1.2943-1.2885; 1.3006-1.3115.
USD/CHF:
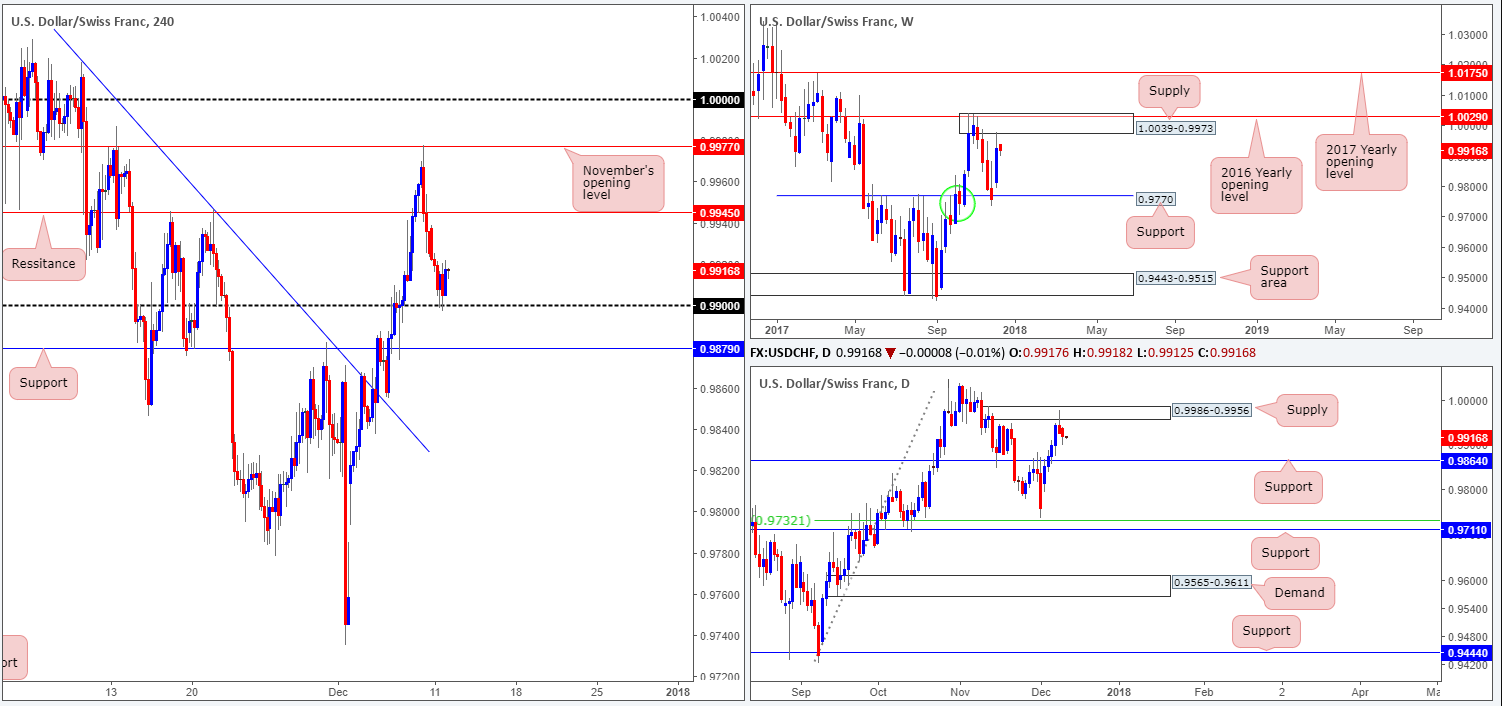
On Friday, H4 price respected November’s opening line at 0.9977 almost to-the-pip, and dominantly traded south until reaching the 0.99 handle mid-way through Monday’s London segment. Yesterday was a relatively quiet session for the pair, with price seen attempting to mildly pare recent losses. In the event that price climbs higher from 0.99, the next area of potential resistance sits at 0.9945. A violation of 0.99 on the other hand, would almost immediately bring this market into contact with a H4 support level pegged at 0.9879.
Turning our attention to the weekly timeframe, we can see that weekly price recently crossed paths with a weekly supply zone at 1.0039-0.9973 that houses the 2016 yearly opening level seen at 1.0029. Along similar lines, daily price is also seen trading from a daily supply zone coming in at 0.9986-0.9956. In fact this daily zone is glued to the underside of the noted weekly area. Should higher-timeframe sellers remain defensive from this point, then the next port of call will likely be the daily support level at 0.9864.
Direction:
• Long: Buying whilst both weekly and daily price are seen selling from supplies is not a trade that echoes high probability!
• Short: Unfortunately selling is just as awkward. A sell beyond 0.99 would place one against potential buying from H4 support at 0.9879. And a break below this support would land one within striking distance of daily support mentioned above at 0.9864.
Data points to consider: US PPI m/m at 1.30pm GMT.
Areas worthy of attention:
Supports: 0.99 handle; 0.9879; 0.9864.
Resistances: 0.9945; 1.0039-0.9973; 1.0029; 0.9986-0.9956.
DOW 30:
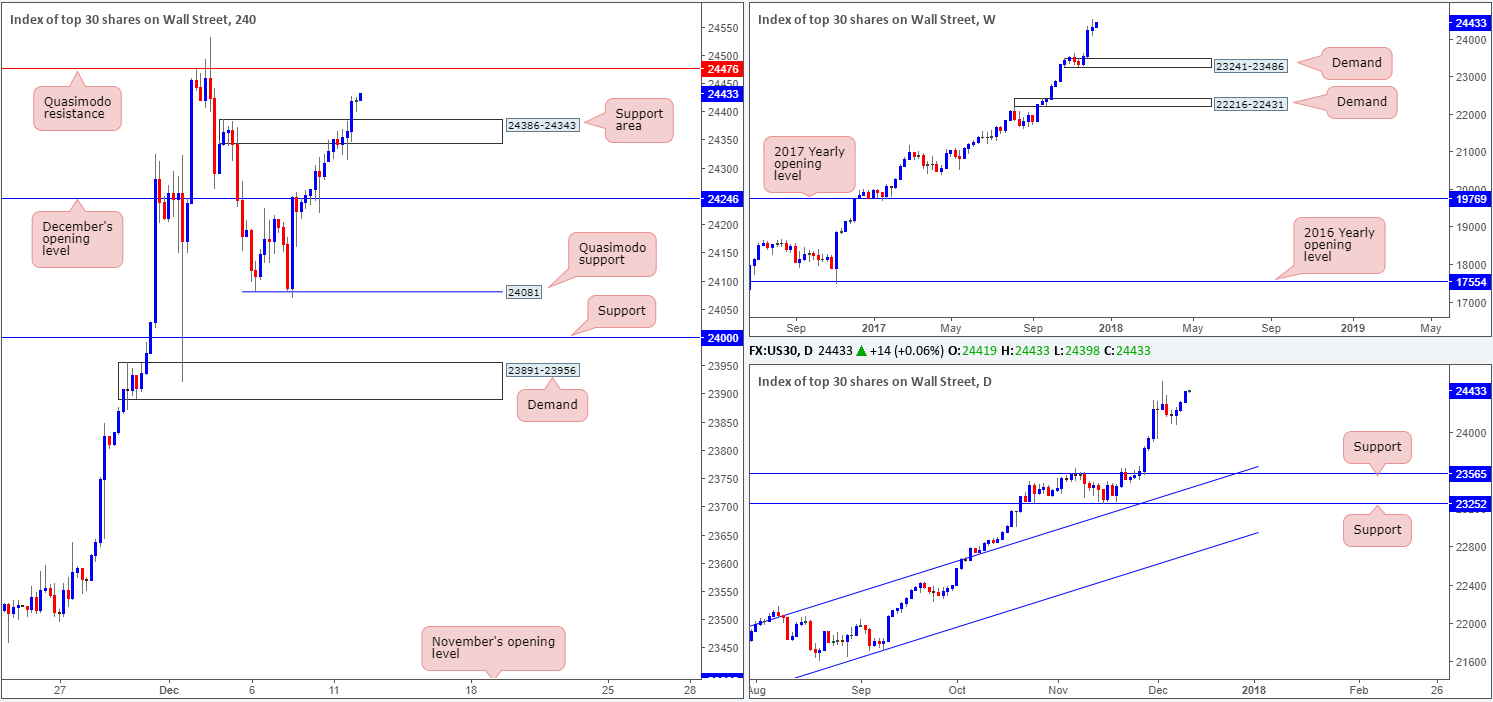
In recent trading, US equities conquered the H4 supply zone positioned at 24386-24343. Sellers’ stop-loss orders have well and truly been filled at this point, and the area is now likely to become a base of support. While this is considered a bullish signal by most, there is a H4 Quasimodo resistance level seen just ahead at 24476. This, in our opinion, is the last barrier of resistance the index has to overcome before fresh record highs can be achieved.
Direction:
• Long: Attempting to buy on any retest seen at the current H4 support area is appealing, given the underlying trend’s strength. However, buying when one can see a potential H4 resistance up ahead is a chancy move. Traders may want to consider exercising a bit of patience here and waiting for H4 price to CLOSE above 24476 and then looking to trade any retest of this level seen thereafter. That way, one can feel confident that there is little resistance on the horizon stopping the unit from rallying.
• Short: Selling the current H4 Quasimodo may work for a small bounce, but it is unlikely to produce anything of worth due to the reasons stated above. Therefore, sell this line with caution!
Data points to consider: US PPI m/m at 1.30pm GMT.
Areas worthy of attention:
Supports: 24386-24343.
Resistances: 24476.
GOLD:
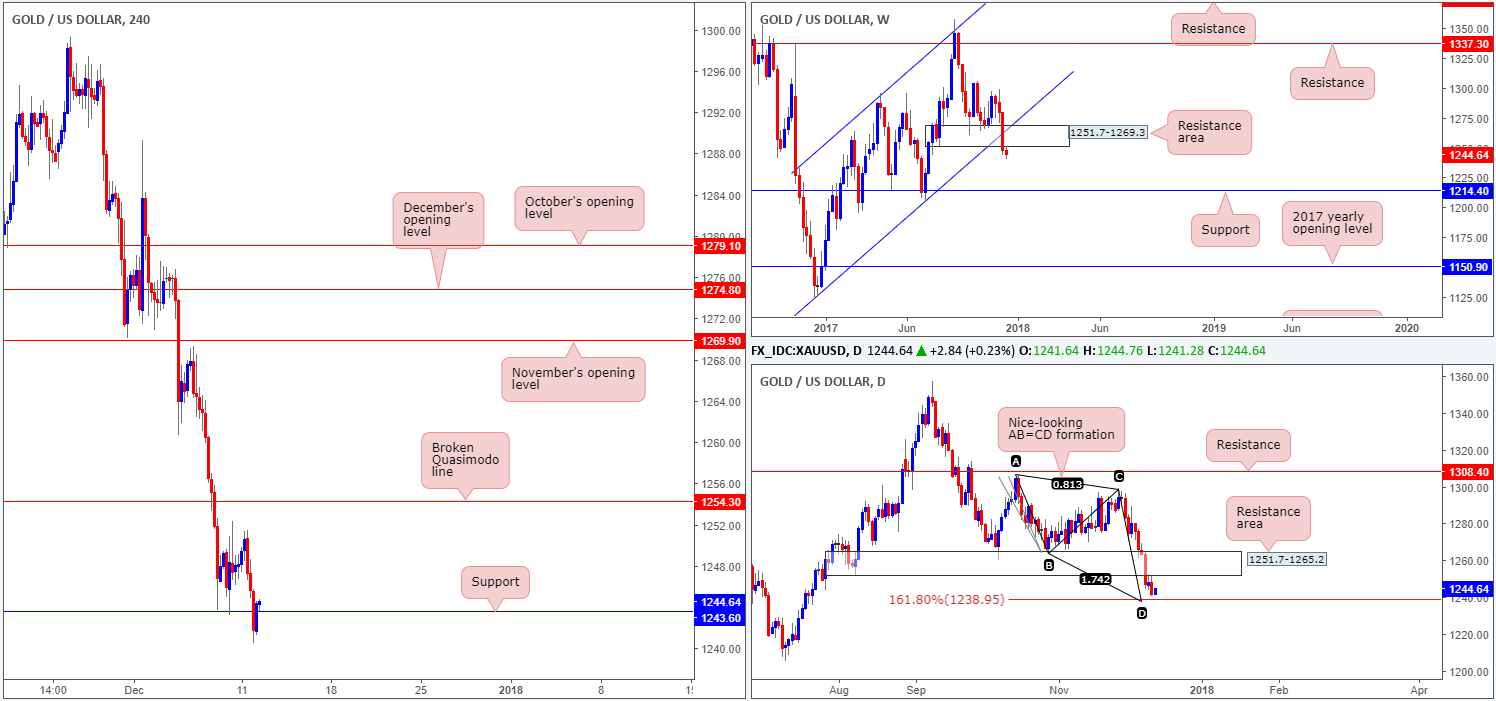
After showing some promise from the H4 support level coming in at 1243.6 last week, the price of the metal tumbled lower on Monday as the US dollar edged to highs of 93.98. As is evident from the H4 timeframe, the H4 support level is not out of this fight yet! Yes, price did crack through this level and touch a low of 1240.5, but the unit quickly switched back to the upside and reclaimed the line amid the early hours of today’s segment.
The recent selling may have something to do with the higher-timeframe picture. With the weekly demand at 1251.7-1269.3 now out of the game (acting resistance area), further downside could be on the cards this week as there’s little support seen in the firing range until we hit the 1214.4 barrier. In conjunction with weekly price, the daily candles also drove beneath a daily demand base drawn from 1251.7-1265.2 (located within the lower edge of the said weekly demand). With daily price retesting the underside of this broken area, we could see the yellow metal reach the daily AB=CD 161.8% Fib ext. point seen below at 1238.9 in the near future.
Direction:
• Long: Buying this market from the current H4 support after such a dominant push below significant higher-timeframe structure is chancy. A lot of traders will likely be looking to sell this momentum on pullbacks.
• Short: A sell from the broken H4 Quasimodo line at 1254.3 is still an option, according to the technical picture. As highlighted in Friday’s outlook, this barrier carries weight due to its position on the higher timeframes: the underside of the broken weekly/daily demands at 1251.7.
Areas worthy of attention:
Supports: 1243.6; 1238.9; 1214.4.
Resistances: 1254.3; 1251.7-1265.2.
