Waiting for lower timeframe confirmation is our main tool to confirm strength within higher timeframe zones, and has really been the key to our trading success. It takes a little time to understand the subtle nuances, however, as each trade is never the same, but once you master the rhythm so to speak, you will be saved from countless unnecessary losing trades. The following is a list of what we look for:
- A break/retest of supply or demand dependent on which way you’re trading.
- A trendline break/retest.
- Buying/selling tails/wicks – essentially we look for a cluster of very obvious spikes off of lower timeframe support and resistance levels within the higher timeframe zone.
We typically search for lower-timeframe confirmation between the M15 and H1 timeframes, since most of our higher-timeframe areas begin with the H4. Stops are usually placed 1-3 pips beyond confirming structures.
EUR/USD:
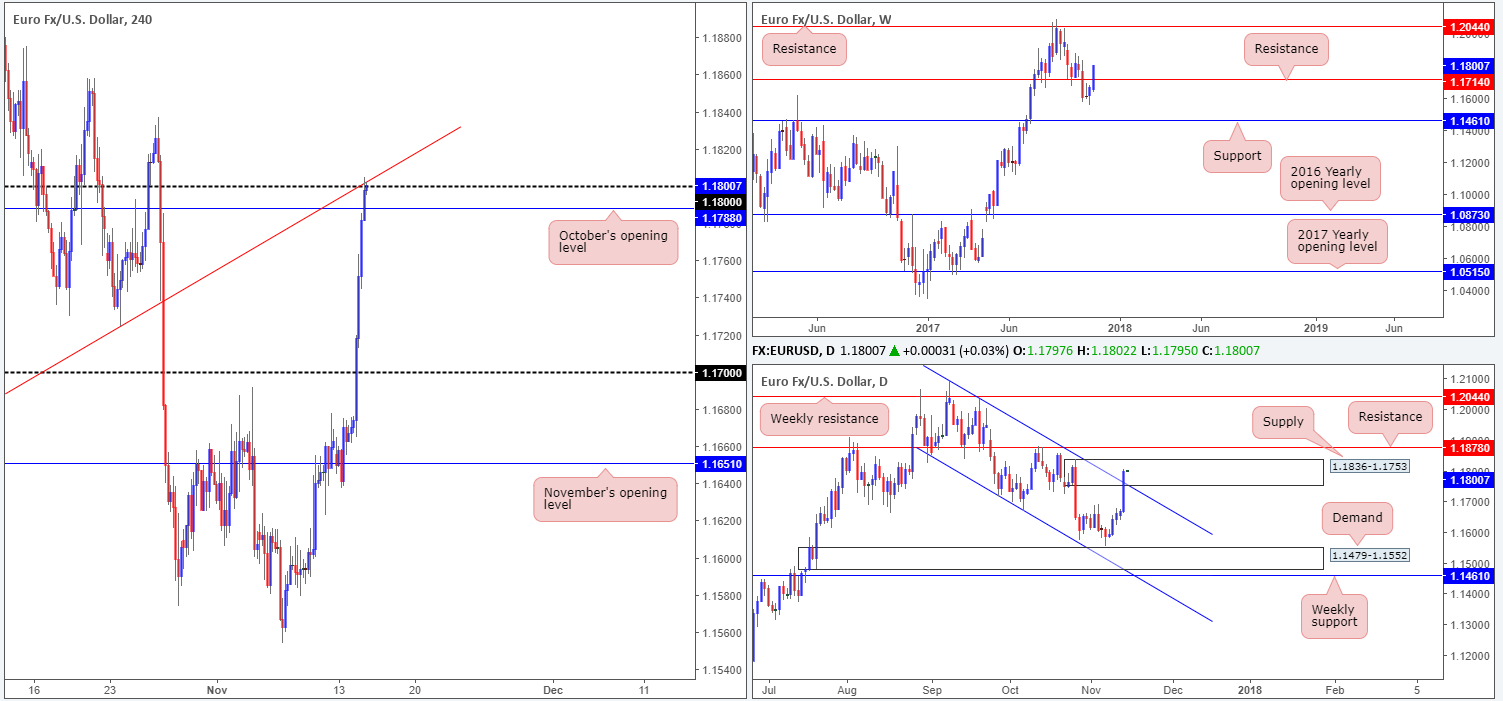
A strong session for the euro on Tuesday lifted prices up to the 1.18 handle, which, as you can see, intersects nicely with a H4 trendline resistance taken from the low 1.1669. Up 130 pips, or 1.15%, yesterday’s advance began in the early hours of London as German growth data came in hotter than expected. The rally was further fueled during the US session as the dollar sharply fell to lows of 93.75.
Over on the weekly timeframe, the pair is seen trading above resistance at 1.1714. Meanwhile, down on the daily timeframe, price action recently breached channel resistance etched from the high 1.2092 and sunk itself into the jaws of a nearby supply area coming in at 1.1836-1.1753.
Suggestions: Building a case for entry on the sell side of this market, we have the psychological band at 1.18 in play that fuses with a H4 trendline resistance. Additionally, there’s also the aforementioned daily supply. Opposing this view, however, is the following:
- On the H4 timeframe, downside from 1.18 is limited as October’s opening level is lurking nearby at 1.1788.
- Although daily price is trading within the walls of a noted supply, one has to take into account that price broke through a channel resistance that has been in motion since September. This, for us, is considered a bullish signal.
- Finally, the break above weekly resistance at 1.1714 should also be taken into account.
As far as we can see, technical elements are mixed at the moment leaving us with little choice but to remain flat for now.
Data points to consider: FOMC member Evan’s speaks at 8am; US inflation and retail sales figures at 1.30pm GMT.
Levels to watch/live orders:
- Buys: Flat (stop loss: N/A).
- Sells: Flat (stop loss: N/A).
GBP/USD:
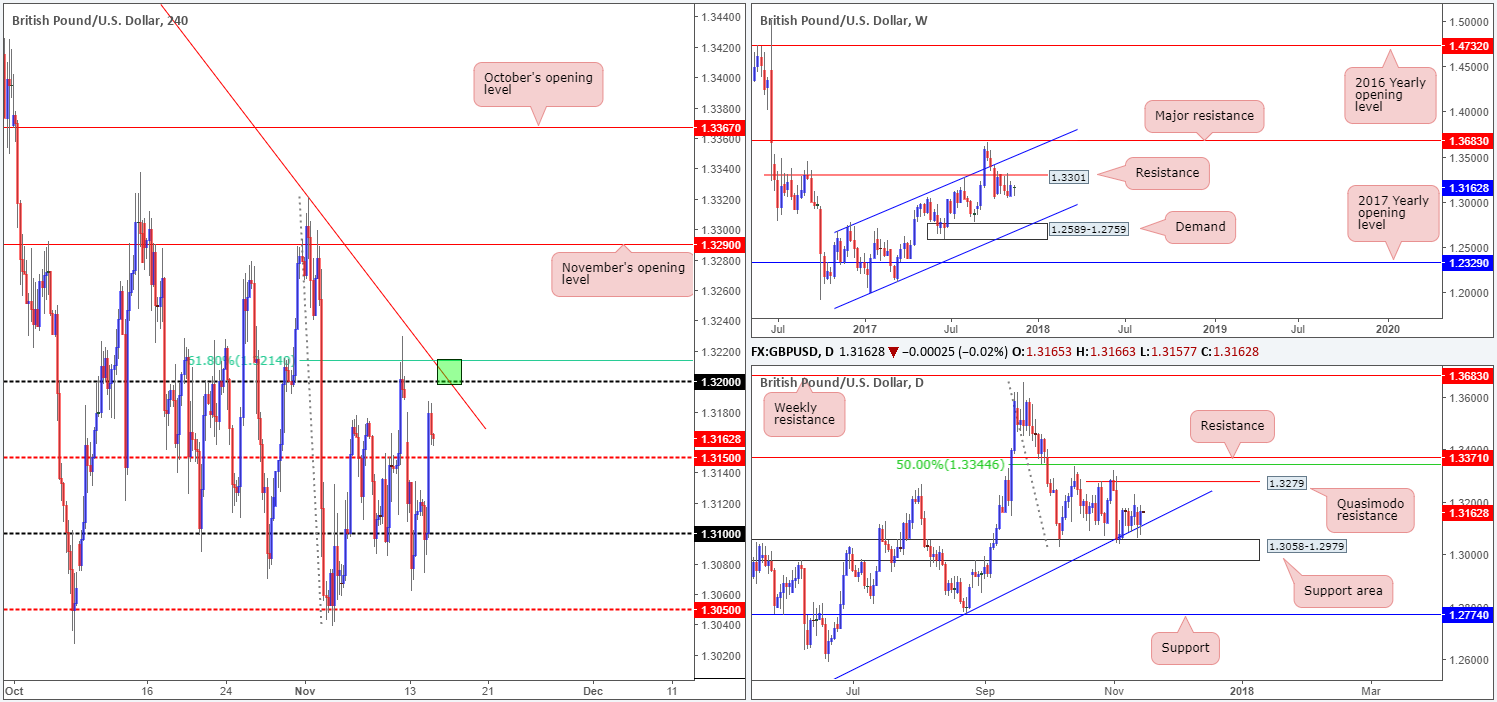
Following a lower-than-expected UK inflation print in the early hours of London trade yesterday, the unit cracked below the 1.31 handle and clocked a low of 1.3073. As can be seen from the H4 timeframe, nevertheless, price failed to sustain this momentum and quickly reversed. Despite a better-than-expected US PPI reading, the dollar tumbled lower, thereby bolstering the GBP and forcing price beyond the H4 mid-level resistance 1.3150 to highs of 1.3186.
Over on the weekly timeframe, we can see that the British pound has been consolidating beneath a resistance level at 1.3301 since early October. Capping downside in this market, however, is a daily trendline support extended from the low 1.2108 and a daily support area coming in at 1.3058-1.2979. One other thing to keep in mind here is the fact that the market, at least from current price on the daily scale, displays room to rally as far north as 1.3279: a daily Quasimodo resistance line.
Suggestions: Regardless of the fact that there are daily supports in play right now, we really like the look of the 1.32 handle for a possible bounce lower today. Besides converging with a H4 trendline resistance taken from the high 1.3657, it also has a 61.8% H4 Fib resistance planted just above it at 1.3214 (green zone). We will almost certainly not take the trade though, given that daily opposition is lurking just below. However, it is still likely worth a bounce, in our humble view.
Data points to consider: UK job’s data at 9.30am; MPC member Broadbent speech at 1pm; FOMC member Evan’s speaks at 8am; US inflation and retail sales figures at 1.30pm GMT.
Levels to watch/live orders:
- Buys: Flat (stop loss: N/A).
- Sells: 1.32 region (likely to bounce price lower today).
AUD/USD:
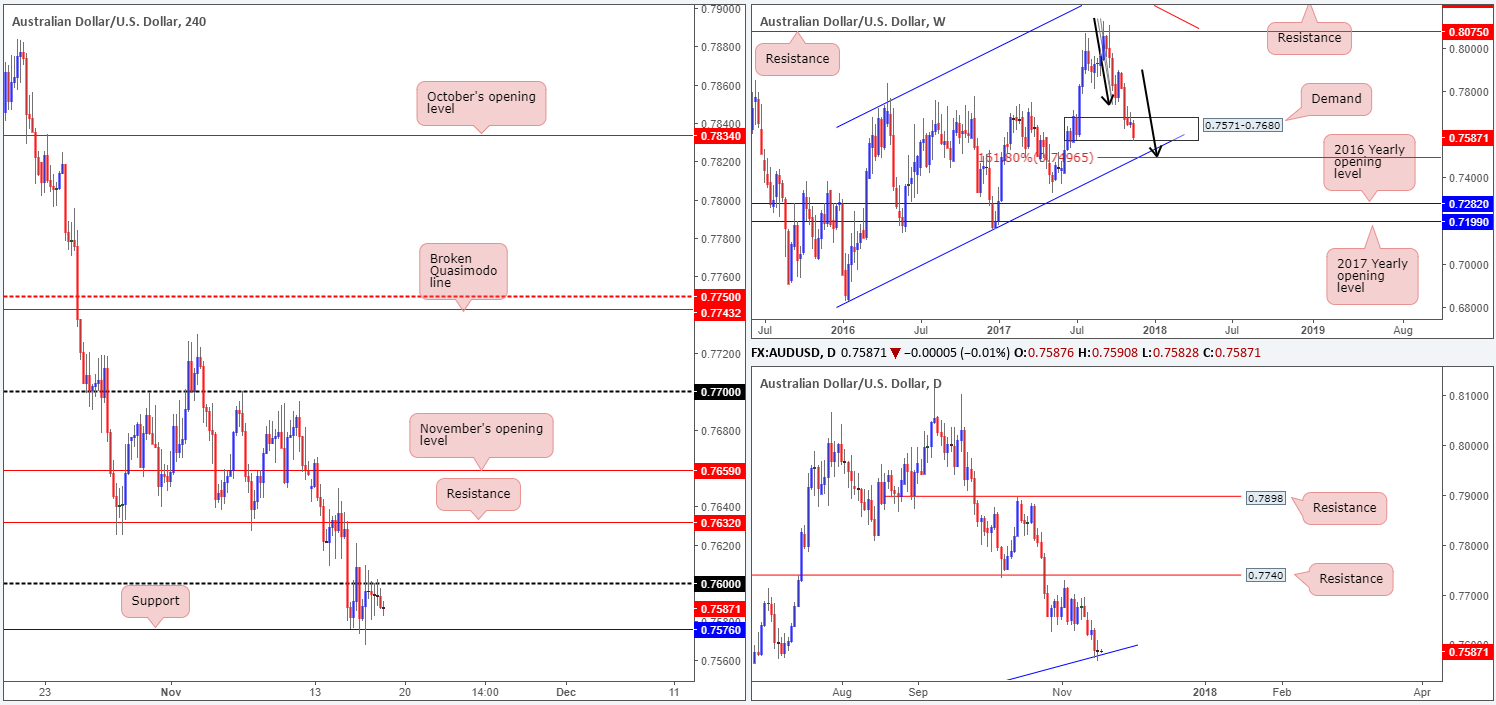
AUD/USD prices are little changed this morning. As is evident from the H4 timeframe, the candles remain capped by a resistance level at 0.7632. To the downside, however, is the 0.76 handle. As highlighted in Tuesday’s report, this psychological band is attractive, not only because it is positioned just beneath a 127.2% H4 Fib ext. point at 0.7607 (taken from the high 0.7700), but also due to it being located within the walls of a weekly demand area at 0.7571-0.7680 and its partner demand seen on the daily timeframe at 0.7571-0.7623.
Suggestions: While there remains downside risk in this market considering the strength of the bears since topping at 0.8125, the 0.76 hurdle still looks appealing for a long. This is largely due to having the option of placing stops BELOW weekly demand mentioned above at 0.7571-0.7680.
Now that our EUR/USD trade is done and dusted, we would consider buying 0.76 today should it enter the fray. The first take-profit line, at least for us, would be the nearby the H4 resistance at 0.7632.
Data points to consider: AUD wage price index q/q at 12.30am; RBA Assist Gov. Ellis speech at 7am; FOMC member Evan’s speaks at 8am; US inflation and retail sales figures at 1.30pm GMT.
Levels to watch/live orders:
- Buys: 0.76 region (stop loss: 0.7569).
- Sells: Flat (stop loss: N/A).
USD/JPY:
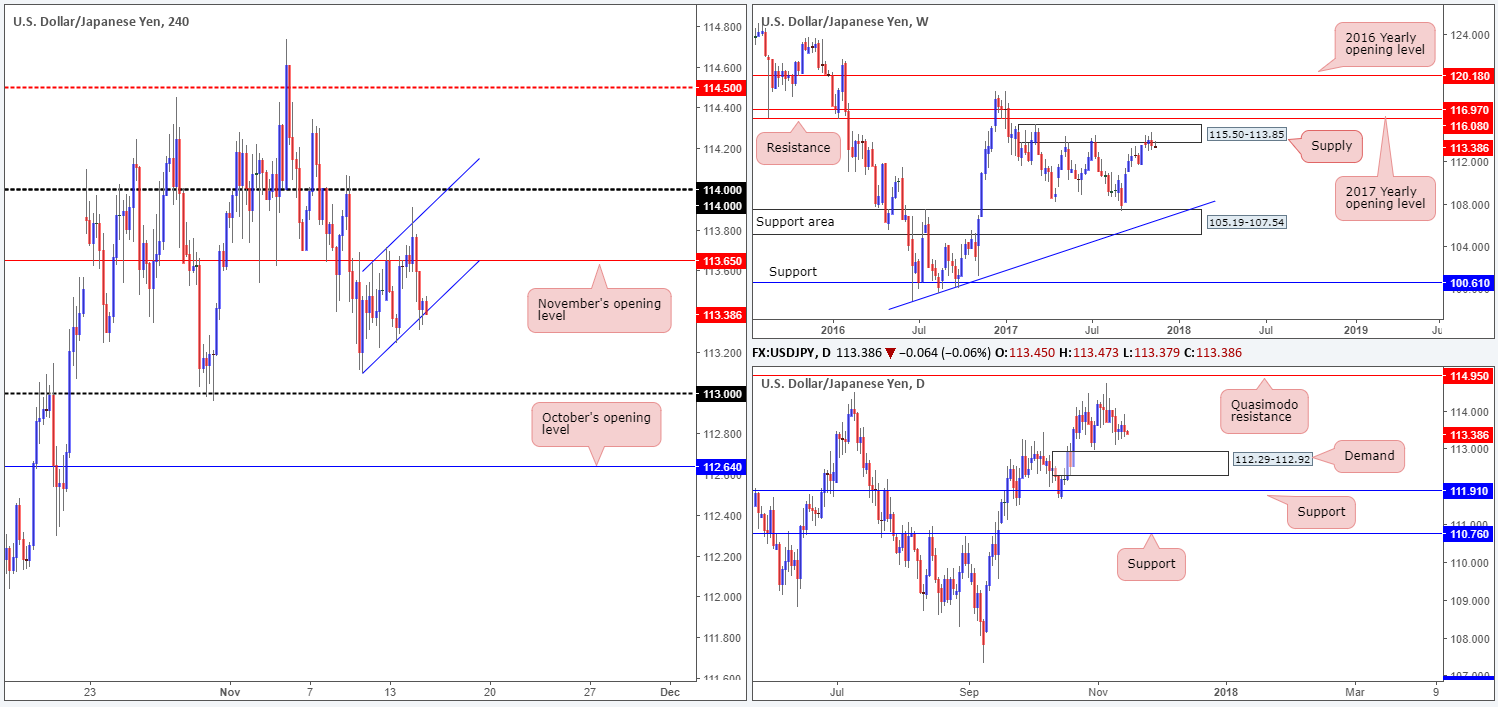
During the early hours of yesterday’s segment, H4 price broke above November’s opening level at 113.65 and tapped a high of 113.91. It was from this point, however, that risk sentiment began to turn sour. Adding to this, US equity indexes gapped lower at the beginning of the US session, thereby pushing the USD/JPY into further losses. As you can see though, losses were mildly pared going into the closing bell from a H4 channel support etched from the low 113.09.
With weekly price still seen trading around the underside of a supply zone at 115.50-113.85, and daily action showing room to punch as far south as demand pegged at 112.29-112.92, the current H4 channel support will likely end up giving way, in our opinion.
Suggestions: Put simply, we’re watching for H4 price to engulf the current channel support and retest the underside of this line as resistance for an intraday short down to 113, followed closely by the top edge of the daily demand at 112.92.
We would advise waiting for a lower-timeframe confirming sell signal (see the top of this report) to form following the retest. This will help confirm if there are active sellers residing here and likely get you in at a more favorable price.
Data points to consider: FOMC member Evan’s peaks at 8am; US inflation and retail sales figures at 1.30pm GMT.
Levels to watch/live orders:
- Buys: Flat (stop loss: N/A).
- Sells: Watch for H4 price to engulf the current channel support and then look to trade any retest seen thereafter ([waiting for a lower-timeframe sell signal to form following the retest is advised] stop loss: dependent on where one confirms this area).
USD/CAD:
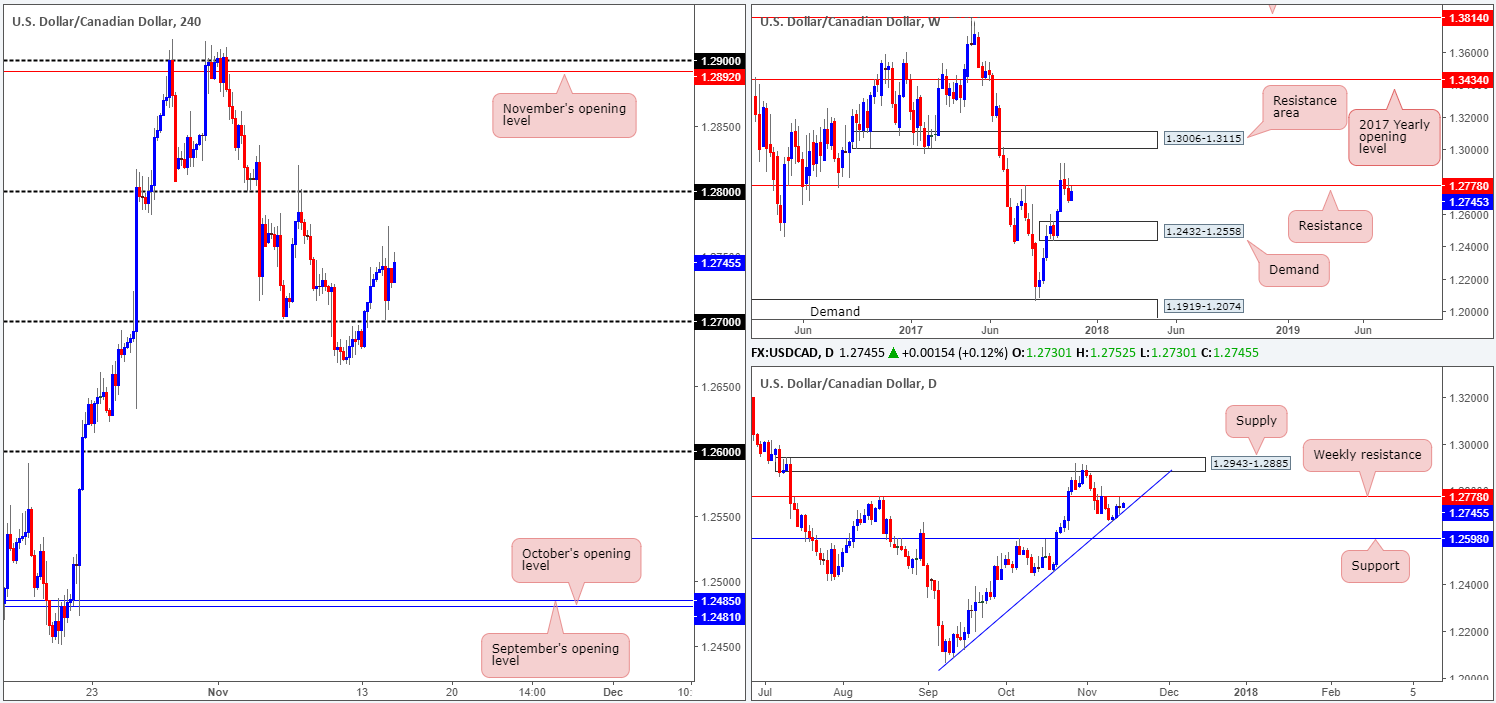
Kicking this morning’s post off with a look at the weekly timeframe, we can see that price is trading within shouting distance of a resistance level pegged at 1.2778. This level boasts a reasonably strong history, and therefore could cap upside movement. Turning our attention to the daily timeframe, the buyers are seen trading from a trendline support extended from the low 1.2061. While this appears as a bullish gesture on the daily scale, one has to remain cognizant of the nearby weekly resistance lurking just ahead!
Across on the H4 timeframe, the candles retested the 1.27 handle to-the-pip on Tuesday and advanced to a high of 1.2773. This was, alongside a sell from the 1.28 region, a noted level to look for longs in yesterday’s report. The reasoning behind the 1.27 long was due to weekly price NOT YET touching resistance, and daily price shaking hands with the aforementioned trendline support. Well done to any of our readers who managed to profit from the 1.27 bounce.
Suggestions: The area seen between the weekly resistance at 1.2778 and the 1.28 handle remains a high-probability sell zone, in our humble view. To avoid being whipsawed out of the position, however, waiting for a full or near-full-bodied bearish H4 candle to form is advised, before pulling the trigger. Remember, psychological levels are prone to fakeouts!
Data points to consider: FOMC member Evan’s speaks at 8am; US inflation and retail sales figures at 1.30pm; US crude oil inventories at 3.30pm; Gov. council member Wilkins speaks at 11.45pm GMT.
Levels to watch/live orders:
- Buys: Flat (stop loss: N/A).
- Sells: 1.28/1.2778 ([waiting for a reasonably sized H4 bearish candle to form – preferably a full or near-full-bodied candle – is advised] stop loss: ideally beyond the candle’s wick).
USD/CHF:
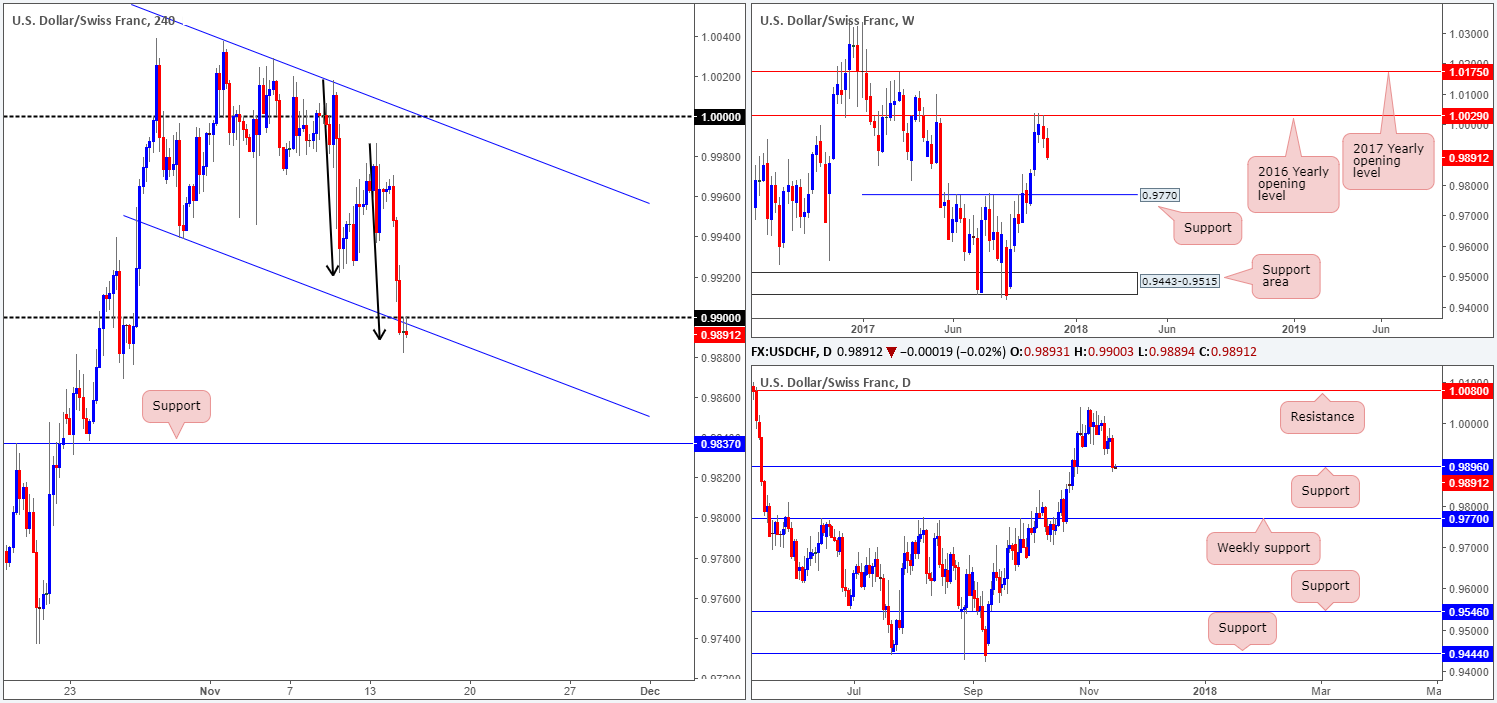
A feeble US dollar, along with an advance in euro markets, sent the USD/CHF considerably lower during trade on Tuesday. The pair wrapped up the day closing beneath the 0.99 handle and also a H4 channel support line taken from the low 0.9939. As we hope is clearly demonstrated on the H4 chart, the unit recently retested the underside of 0.99 (and its fusing channel support-turned resistance). According to H4 structure, further losses could very well be on the horizon down to as far as the support level coming in at 0.9837. In addition to this, we can also see that weekly price, after tapping the 2016 yearly opening level at 1.0029, shows room to trade as far south as support drawn from 0.9770.
The flip side to the above, however, is that H4 flow just recently completed a symmetrical AB=CD bullish formation see black arrows) and daily price shook hands with support at 0.9896.
Suggestions: Having seen weekly price promoting bearish intent, along with daily price trading from a support level, we remain wary. Making it even more difficult though is the H4 timeframe. Under 0.99 price looks poised to push lower, but with the AB=CD bullish formation in play, this could potentially halt further selling.
In the absence of clearer price action, we have decided to remain flat during today’s sessions.
Data points to consider: FOMC member Evan’s speaks at 8am; US inflation and retail sales figures at 1.30pm GMT.
Levels to watch/live orders:
- Buys: Flat (stop loss: N/A).
- Sells: Flat (stop loss: N/A).
DOW 30
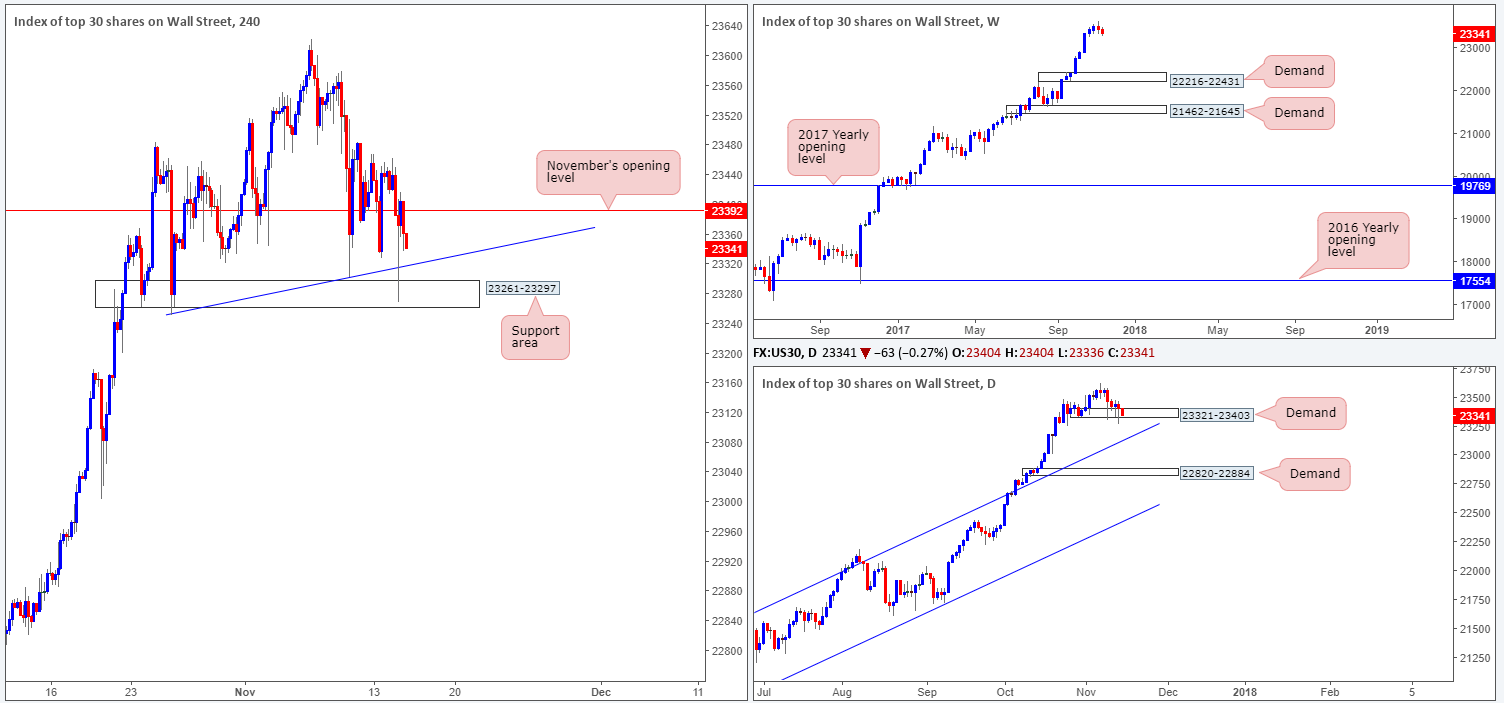
US equities managed to recover some of the early losses on Tuesday after stabbing through a H4 trendline support extended from the low 23250 and challenging a H4 support area at 23261-23297. Despite this, Wall Street ended the day marginally lower.
As we write, H4 price is seen trading sub November’s opening level at 23392. Meanwhile, daily action remains bolstered by a demand area coming in at 23321-23403. A break beyond this barrier could lead to a move being seen down to the daily trendline support extended from the high 21541.
Suggestions: We do not see much in the way of trading opportunity to hang our hat on today.
A break below the current H4 support area would, we agree, confirm bearish intent from the recently formed weekly bearish engulfing candle. But what it would also do is place one within touching distance of the nearby daily trendline support mentioned above, thus possibly limiting downside potential.
Data points to consider: FOMC member Evan’s speaks at 8am; US inflation and retail sales figures at 1.30pm GMT.
Levels to watch/live orders:
- Buys: Flat (stop loss: N/A).
- Sells: Flat (stop loss: N/A).
GOLD:
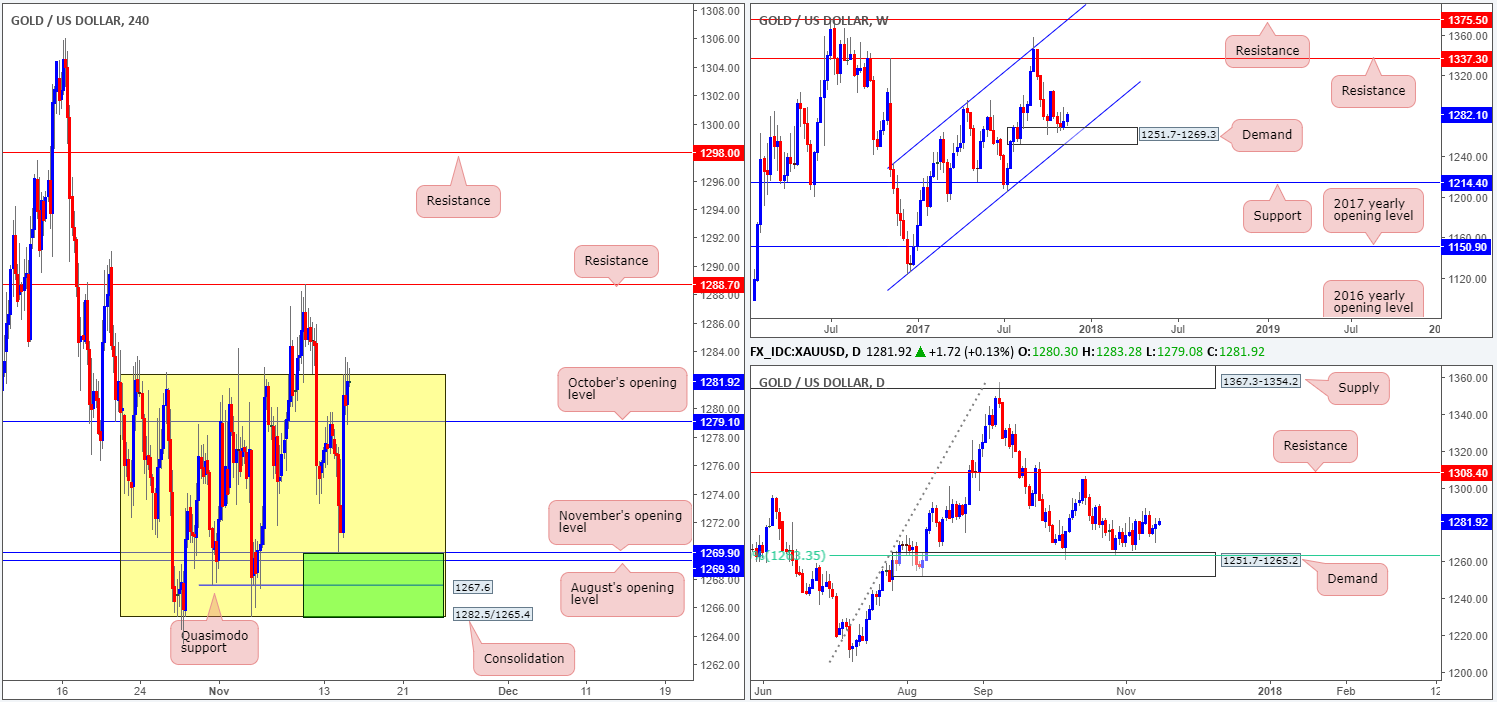
For those who read Tuesday’s report you may recall that the team highlighted a possible buy zone at 1265.4/1269.9 (green area) seen on the H4 timeframe. The lower edge of the current H4 range at 1265.4, as well as the nearby H4 Quasimodo support at 1267.6 along with August and September’s opening levels seen just above at 1269.3/1269.9 formed a strong-looking area.
As you can see, price struck the top edge of this zone to-the-pip going into the London session, and the bulls wasted very little time in reasserting dominance here! Well done to any of our readers who managed to jump on board this move!
Suggestions: With H4 price now seen tackling the top edge of the current H4 range at 1282.5, the next upside target beyond this line can be seen at 1288.7: a H4 resistance. Therefore, should the H4 candles breakout from 1282.5, and retest this edge as support, an intraday long play could be an option up to 1288.7. Further upside could be seen beyond 1288.7, however, given the clear run up to H4 resistance at 1298.0 and the bigger picture showing weekly price could advance as high as weekly resistance at 1337.3.
Levels to watch/live orders:
- Buys: Watch for H4 price to engulf 1282.5 and then look to trade any retest seen thereafter ([waiting for a lower-timeframe buy signal to form – see the top of this report – following the retest is advised] stop loss: dependent on where one confirms this area).
- Sells: Flat (stop loss: N/A).
