Lower timeframe confirmation: simply means waiting for price action on the lower timeframes to confirm direction within a higher timeframe area. For example, some traders will not enter a trade until an opposing supply or demand area has been consumed, while on the other hand, another group of traders may only need a trendline break to confirm direction. As you can probably imagine, the list is endless. We, however, personally prefer to use the two methods of confirmation mentioned above in our trading.
EUR/USD:
Going into yesterday’s European/London session the EUR pair was forced lower, surpassing the psychological barrier 1.1000 and connecting up with a 4hr demand area seen at 1.0886-1.0924. It was at this point (the U.S open) where we saw relatively aggressive buyers come in on the back of latest rumors regarding a possible Greece deal this weekend, which, as you can see, spring boarded price above1.1000 which just missed hitting the mid-level number 1.1050 by a pip before selling off back down to 1.1000.
Technically, the higher timeframe structure remains unchanged. Price is still seen trading mid-range on the weekly timeframe between 1.1532-1.1278 (a weekly supply area), and 1.0519-1.0798 (a weekly demand zone). Meanwhile on the daily scale, price continues to be supported by the daily demand at 1.0886-1.0978 with room seen above to move higher.
Trading this market, at least technically, has been and will continue to be difficult until the Greece debt situation is resolved in our opinion. With that being said, we are not buying into this latest rumor, and ultimately feel this pair is heading further south based on the fear plaguing this market that the ‘no’ vote could backfire on the Greeks.
At this time, we see no logical areas to trade from, and with the current political climate this is probably a good thing! As such, opting to stand on the side lines here is likely the best path to take.
Levels to watch/live orders:
- Buys: Flat (Stop loss: N/A).
- Sells: Flat (Stop loss: N/A).
GBP/USD:
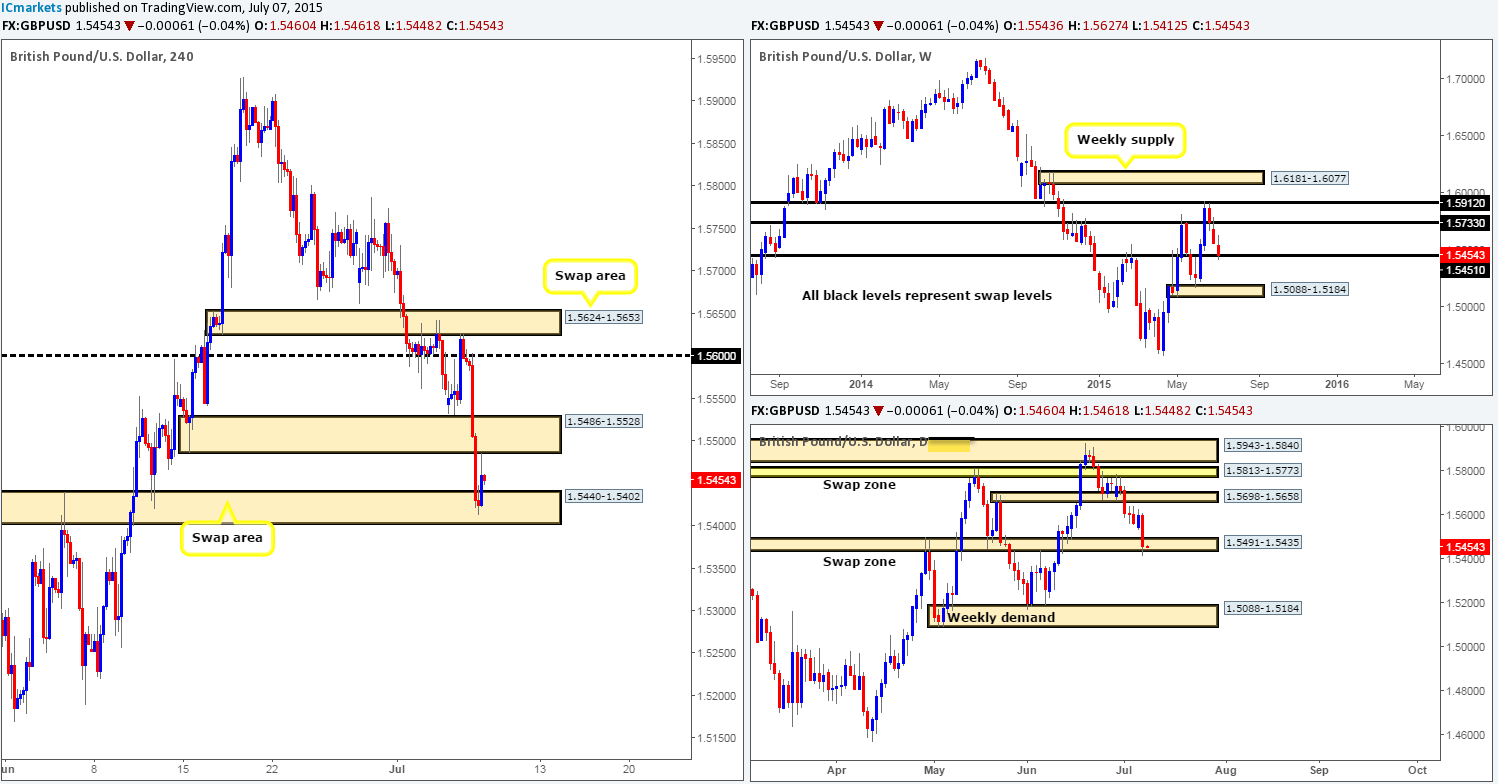
A strong wave of sellers came into the market yesterday from the 1.5600 region. For those who read our previous report, you may recall that we mentioned that if 1.5600 held firm, we would consider a small intraday short position. Unfortunately, we did not manage a sell here, but there was a lovely looking retest at 1.5600 literally thirty or so minutes before the floor fell from under the GBP.
Consequent to the recent drop, the weekly timeframe shows price is now nibbling at a weekly swap level coming in at 1.5451, and by the same token, the daily timeframe also shows price situated within a daily swap zone visible at 1.5491-1.5435. Moving down to the 4hr timeframe, we can see that price reacted nicely to a small 4hr swap area at 1.5440-1.5402 (located just below both higher timeframe swap barriers), which as you can see forced price north to cross swords with a recently broken 4hr demand area at 1.5486-1.5528.
Given the points made above (see bold), price could potentially rally higher today taking back some of its recent losses. However, to do this, offers must first be cleared from 1.5486-1.5528. If a break higher is indeed seen, there could be a potential intraday buying opportunity on any retest seen at this area, targeting 1.5600. A break below the current 4hr swap zone on the other hand, would likely suggest a more bearish bias going into the rest of this week, as we would not just be breaking a 4hr area here, we would also be violating weekly and daily structures as well.
Levels to watch/ live orders:
- Buys: Flat (Stop loss: N/A).
- Sells: Flat (Stop loss: N/A)
AUD/USD:
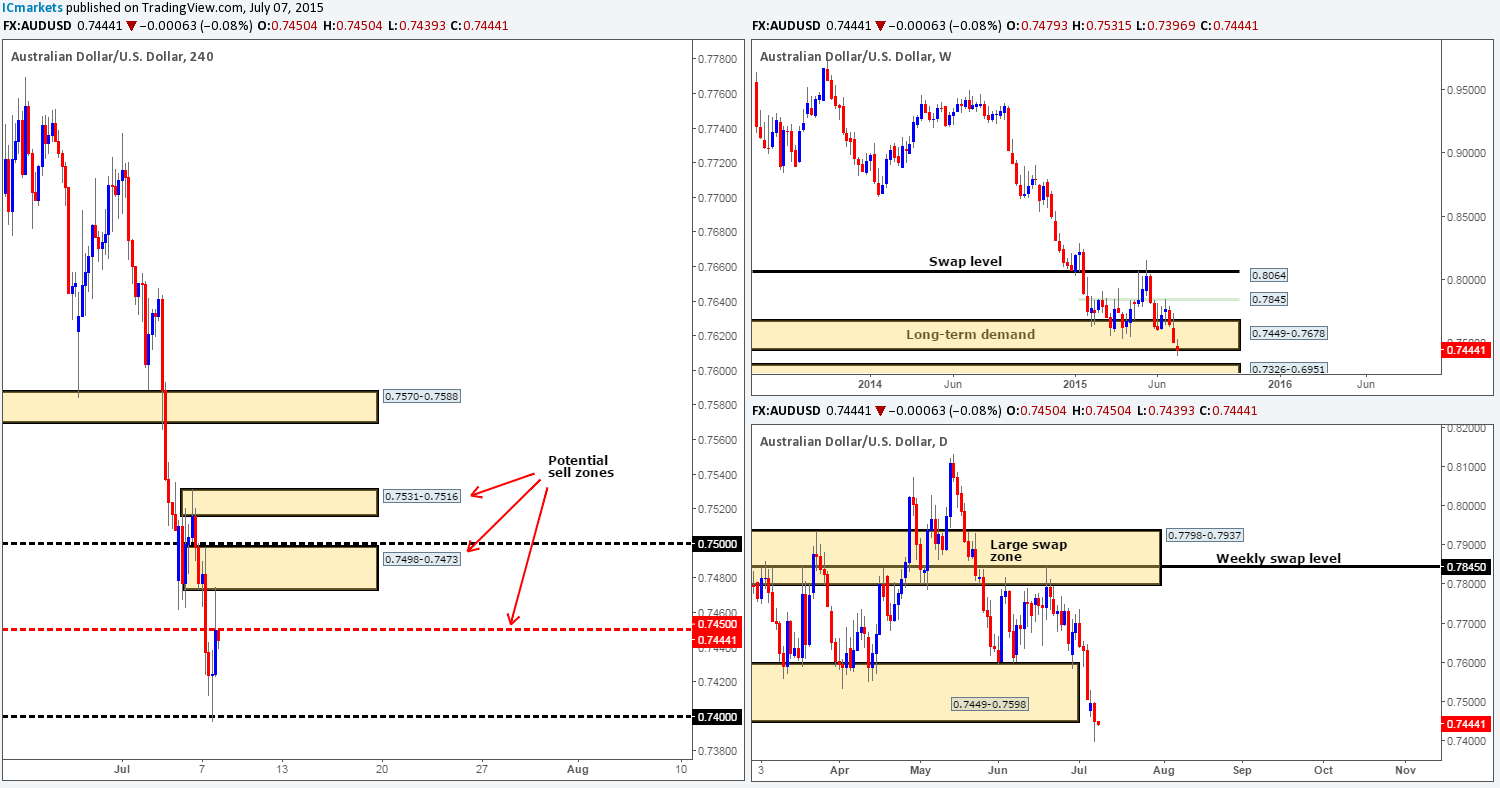
The Aussie took another pounding during yesterday’s trade. Price smashed through the mid-level hurdle 0.7450 and touched gloves with 0.7400, which, as you can see, was clearly enough to support a counter-attack up to a small, yet clearly responsive 4hr supply zone coming in at 0.7498-0.7473.
Checking in on the higher timeframes, we can now see that the long-term weekly demand area at 0.7449-0.7678 and its partner demand on the daily timeframe at 0.7449-0.7598 has been violated. As such, the prevailing downtrend on this pair can now resume. That being the case, our prime focus today and likely for the rest of the week will be on shorts. Areas we currently have noted are as follows:
- 4hr supply at 0.7531-0.7516. This area could be used as a fakeout barrier for the supply area mentioned at number two.
- 4hr supply at 0.7498-0.7473.
- The current mid-level hurdle 0.7450.
Since there are three possible reactive zones, we are going to refrain from placing pending orders. Instead, we’re going to watch for confirming lower timeframe price action as this should help curb any losses that might otherwise be seen when using pending orders.
Levels to watch/ live orders:
- Buys: Flat (Stop loss: N/A).
- Sells: 0.7450 [Tentative – confirmation required] (Stop loss: dependent on where one confirms this level) 0.7498-0.7473 [Tentative – confirmation required] (Stop loss: 0.7502) 0.7531-0.7516 [Tentative – confirmation required] (Stop loss: 0.7535).
USD/JPY:
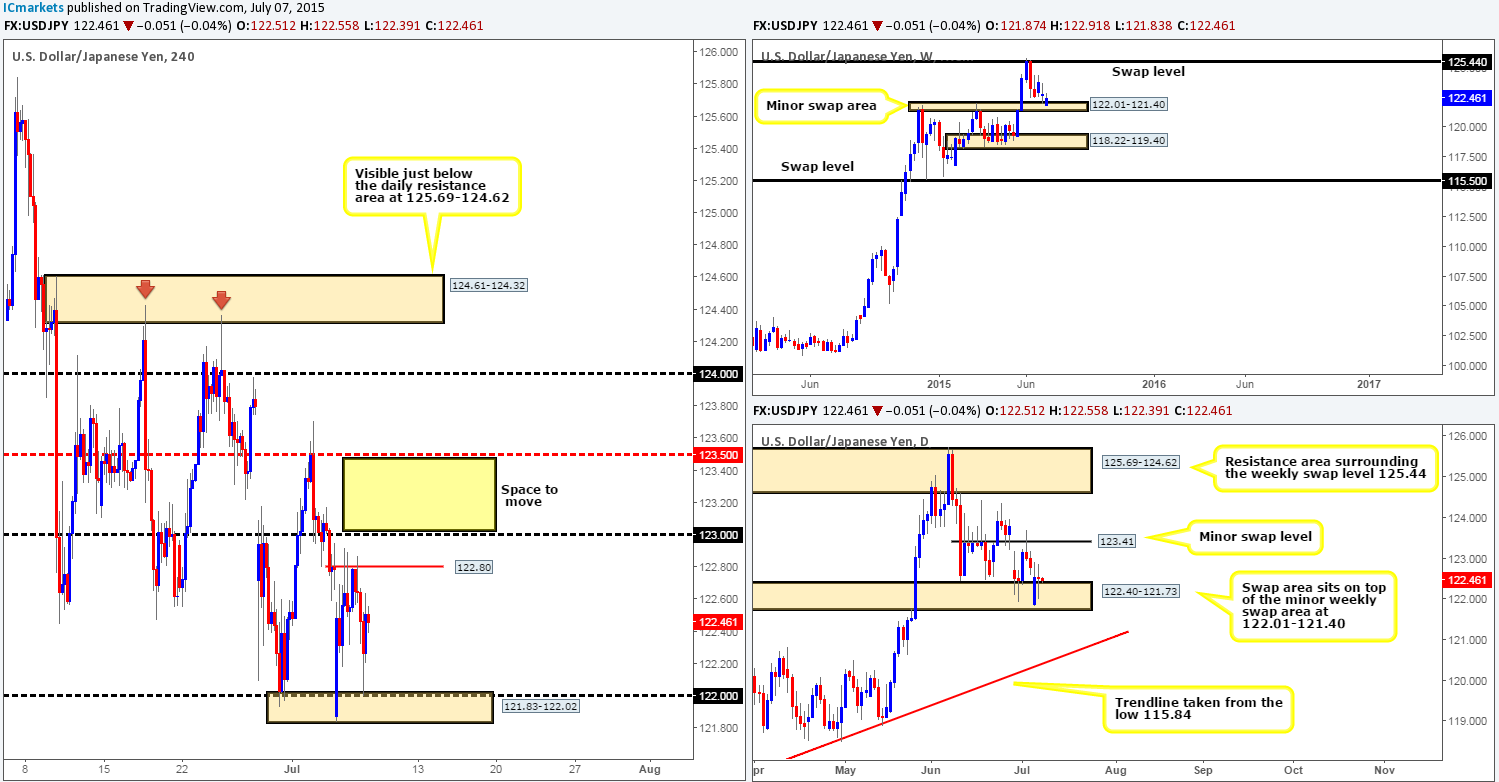
For those who read our previous report, you may recall that we mentioned to keep an eye on the 4hr buy zone at 121.83-122.02 for potential long opportunities. As you can see price hit our 4hr area literally to-the-pip and has so far held higher. We managed to get in long on this from the 5 minute timeframe at 122.090 following a fakeout below the 5 minute low seen at 122.026. Well done to any of our readers that also managed a long from here!
With both the weekly and daily charts showing price trading side-by-side within demand (122.01-121.40 – 122.40-121.73) at the moment, we believe that this market has the potential to extend higher. Ultimately, what we’re looking for is price to cut through 123.00 as there is clear space above this number up to at least the mid-level barrier 123.50. If this does take place, our team has already noted that they would be prepared to add to the current long position on any confirmed retest seen at 123.00.
Levels to watch/ live orders:
- Buys: 122.090 [Live] (Stop loss: 121.80).
- Sells: Flat (Stop loss: N/A).
USD/CAD:
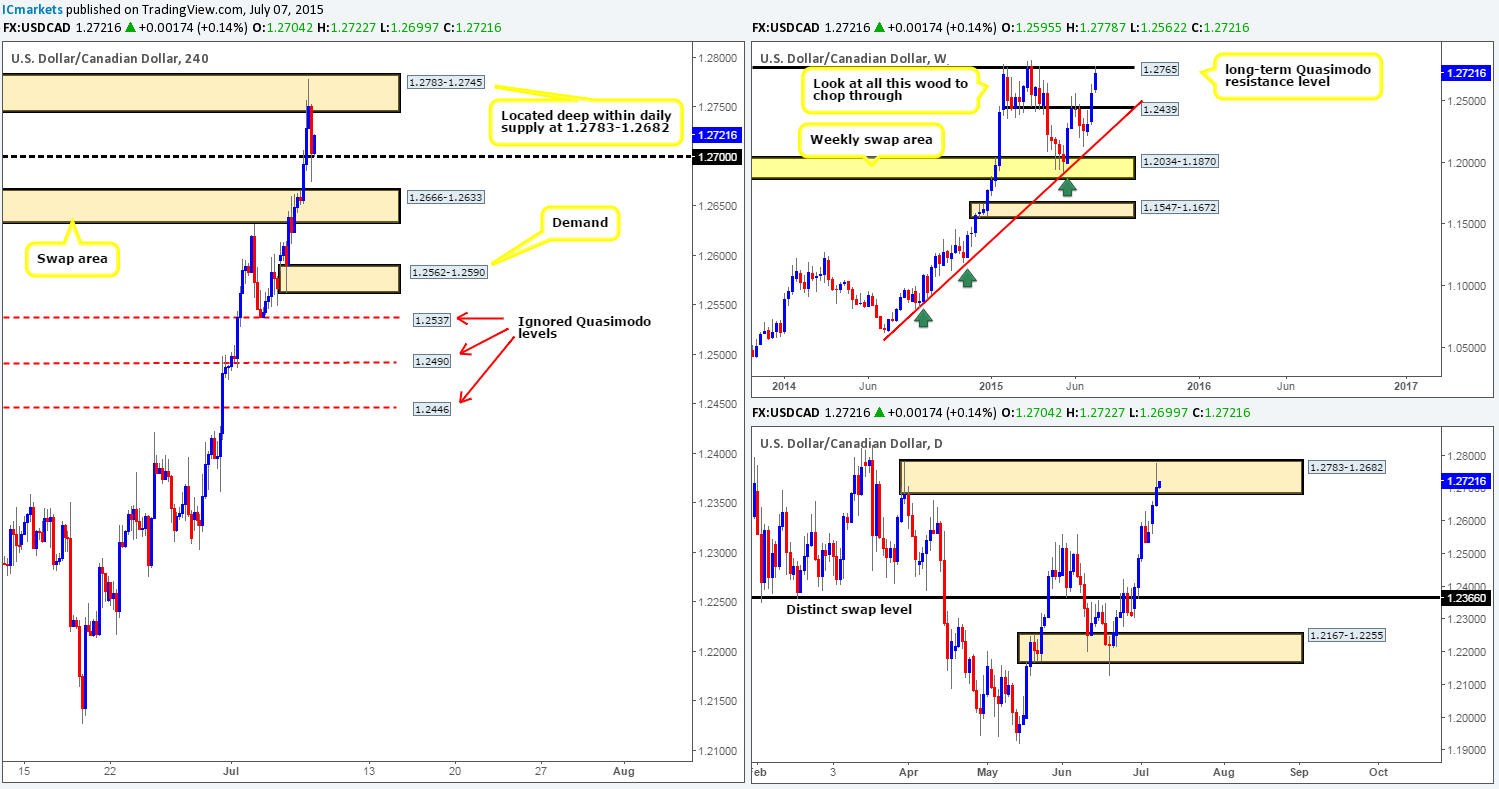
The bulls continued pressing forward during the European/London session yesterday, consequently forcing price to collide with a 4hr supply area at 1.2783-1.2745 which held firm going into the U.S session.
A consensus is being seen across the board regarding higher timeframe structure. The weekly chart now shows price tackling with a long-term weekly Quasimodo resistance level at 1.2765, while on the daily timeframe, we can see price chewing on a daily supply zone coming in at 1.2783-1.2682. As such, our primary focus today and likely for the rest of the week will be on looking for shorts.
From the 4hr timeframe, however, price is now hugging the round number 1.2700 which is potential support and is certainly not something our team would want to sell into, no matter what the higher timeframe structure is telling us. In fact, looking below this number there is not really any clear space allowing us to short unless targeting very small gains. With this in mind, remaining flat until more conducive price action presents itself is the route we have chosen to take.
Levels to watch/ live orders:
- Buys: Flat (Stop loss: N/A).
- Sells: Flat (Stop loss: N/A).
USD/CHF:
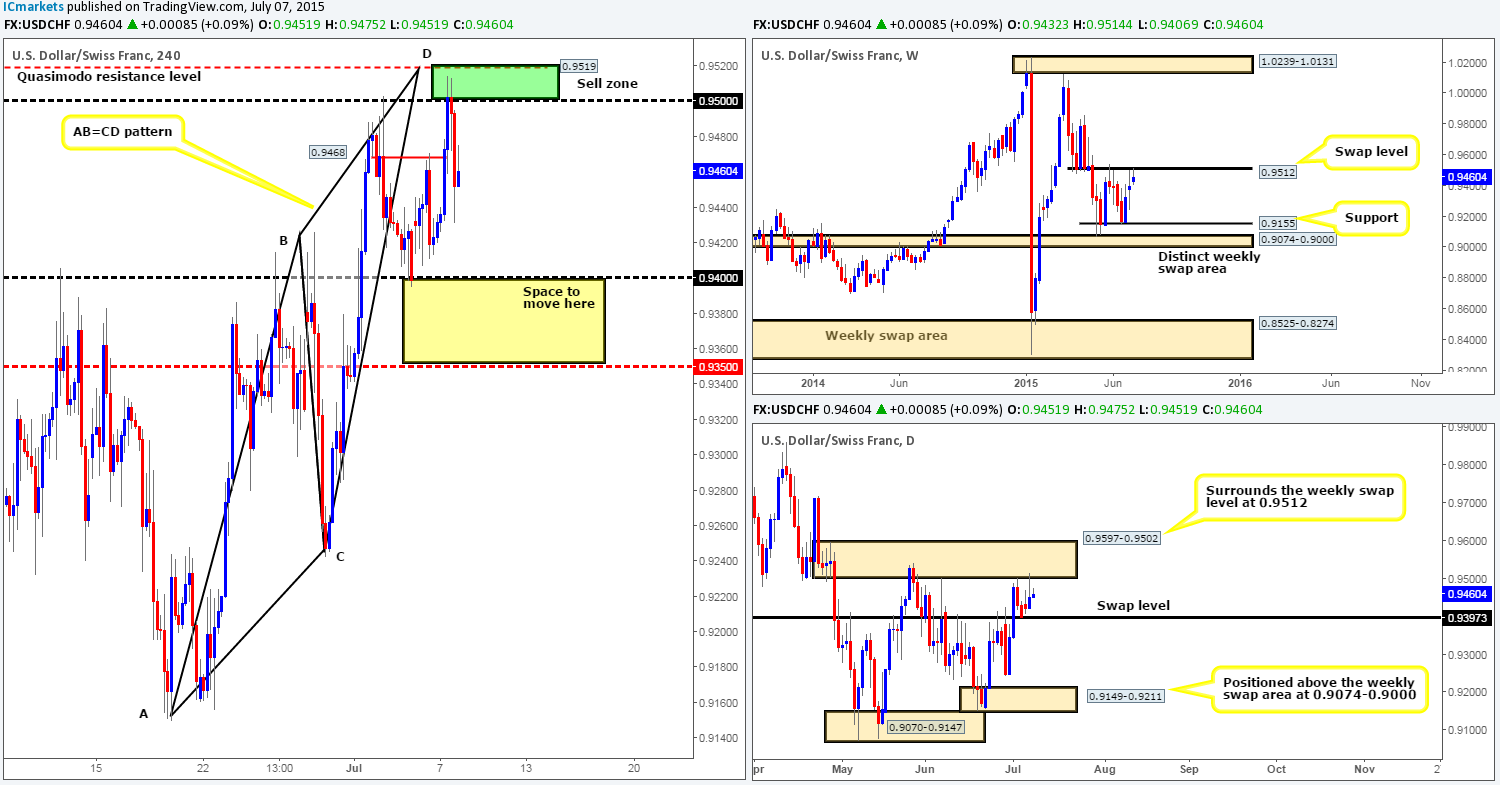
The USD/CHF pair, as you can see, rallied during the course of yesterday’s sessions, taking out 0.9468 and jabbing into our pre-determined 4hr sell zone between 0.9500/0.9519.
For those who did not read our previous report, here is a quick snippet as to why we believed price would reverse where it did:
- Price would be nibbling at the weekly swap level (0.9512).
- Price would also be trading within daily supply (0.9597-0.9502).
- 0.9519 (a 4hr Quasimodo resistance level) provides this market a beautiful fakeout barrier above 0.9500 to repel price.
- A 4hr Harmonic AB=CD pattern completes right at the point of our 4hr Quasimodo resistance level.
Since we are already long the USD/JPY at the moment, we decided to pass on shorting this pair. Well done to anyone who did manage a sell here though, as this move could turn out to be very profitable indeed. If we were short, we’d be looking down to the 0.9400 handle as our first take-profit area, and from there on we’d likely trail the action, placing our stop behind logical resistance levels as price moved in our favor.
Other than the above, we do not see any immediate opportunity to trade this pair until we see either a pullback up to the aforementioned 4hr sell zone which could provide a second chance to short this pair, or price breaks below 0.9400, where in which case the path south would likely be clear down to the mid-level barrier 0.9350.
Levels to watch/ live orders:
- Buys: Flat (Stop loss: N/A).
- Sells: 0.9500/0.9519 [Tentative – confirmation required] (Stop loss: dependent on where one confirms this area).
DOW 30:
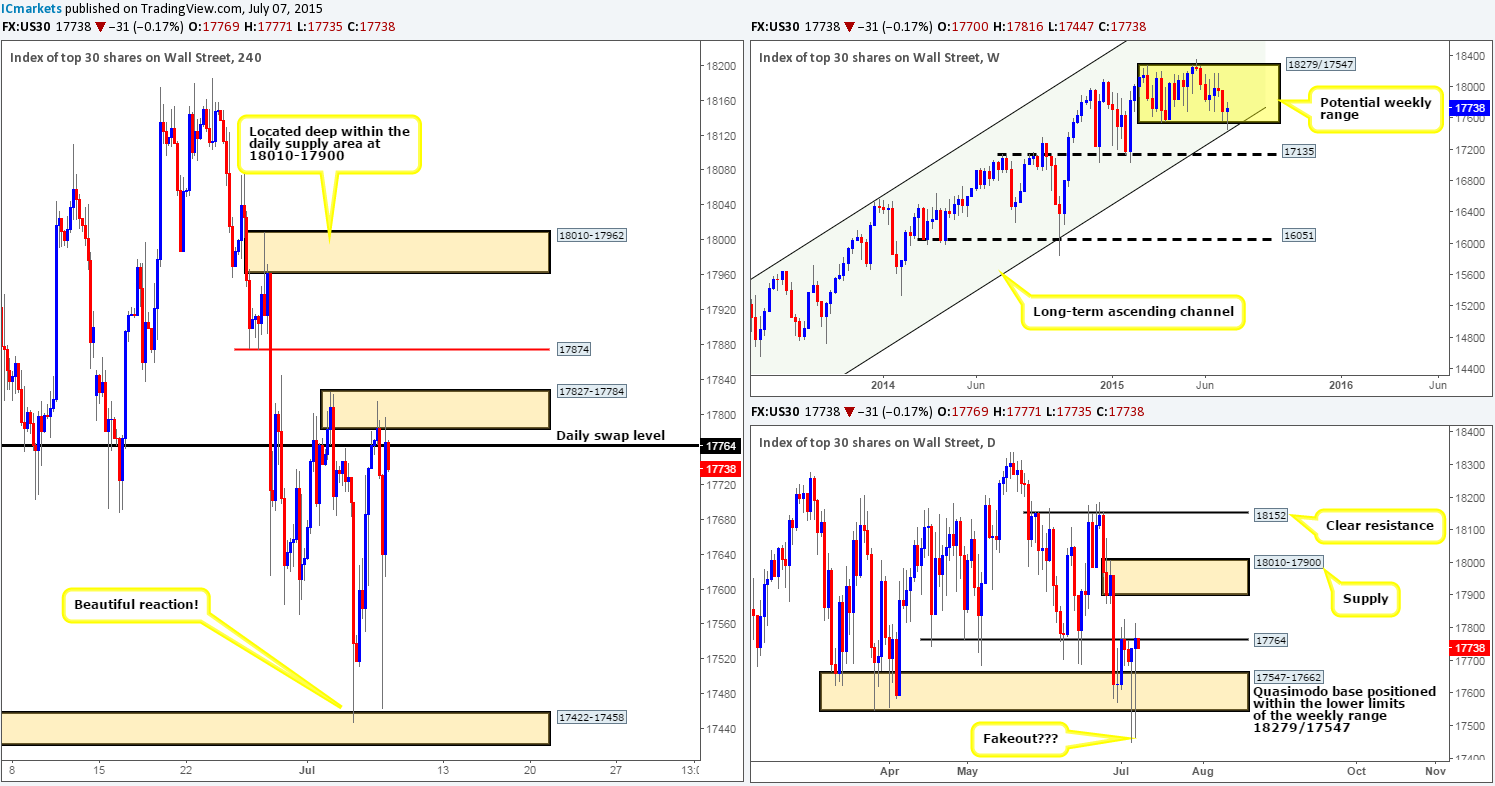
Heavy volatility was seen in this market throughout yesterday’s sessions. Price not only went one-on-one with a 4hr supply area at 17827-17784, but also was seen nearly bumping heads once again with a 4hr demand area at 17422-17458. Despite this flurry of buying and selling, price closed a mere 30 points above yesterday’s close. With that, at least from a technical standpoint there has not been much of a change seen.
Our team still remains unsure as to whether or not the spike below the daily Quasimodo base at 17547-17662 was a fakeout. A fakeout can only be confirmed in our opinion once we see a daily close above the daily swap level 17764. However, supporting a possible fakeout, price is seen trading at the lower limits of a potential weekly range at 18279/17547. The interesting thing about this though is that price has also collided with support from a long-term weekly ascending channel taken from the low 10402 and high 13270.
So, with all of the above taken on board, we’d ultimately like to see price close above the aforementioned daily swap level on the 4hr timeframe today, and push into any remaining offers residing within the 4hr supply area at 17827-17784. We could then potentially begin looking for a buy trade on any retest seen at 17764, targeting 17874 as the first take-profit target, and all being the well the 4hr supply zone coming in at 18010-17962 (located deep within the aforementioned daily supply area) as our second and final take-profit zone. Just to be clear here guys, we have no intention on entering @ market at this level, lower timeframe confirmation would need to be seen before we’d even begin considering risking capital to this idea.
Levels to watch/ live orders:
- Buys: Flat (Stop loss: N/A).
- Sells: Flat (Stop loss: N/A).
XAU/USD: (Gold)
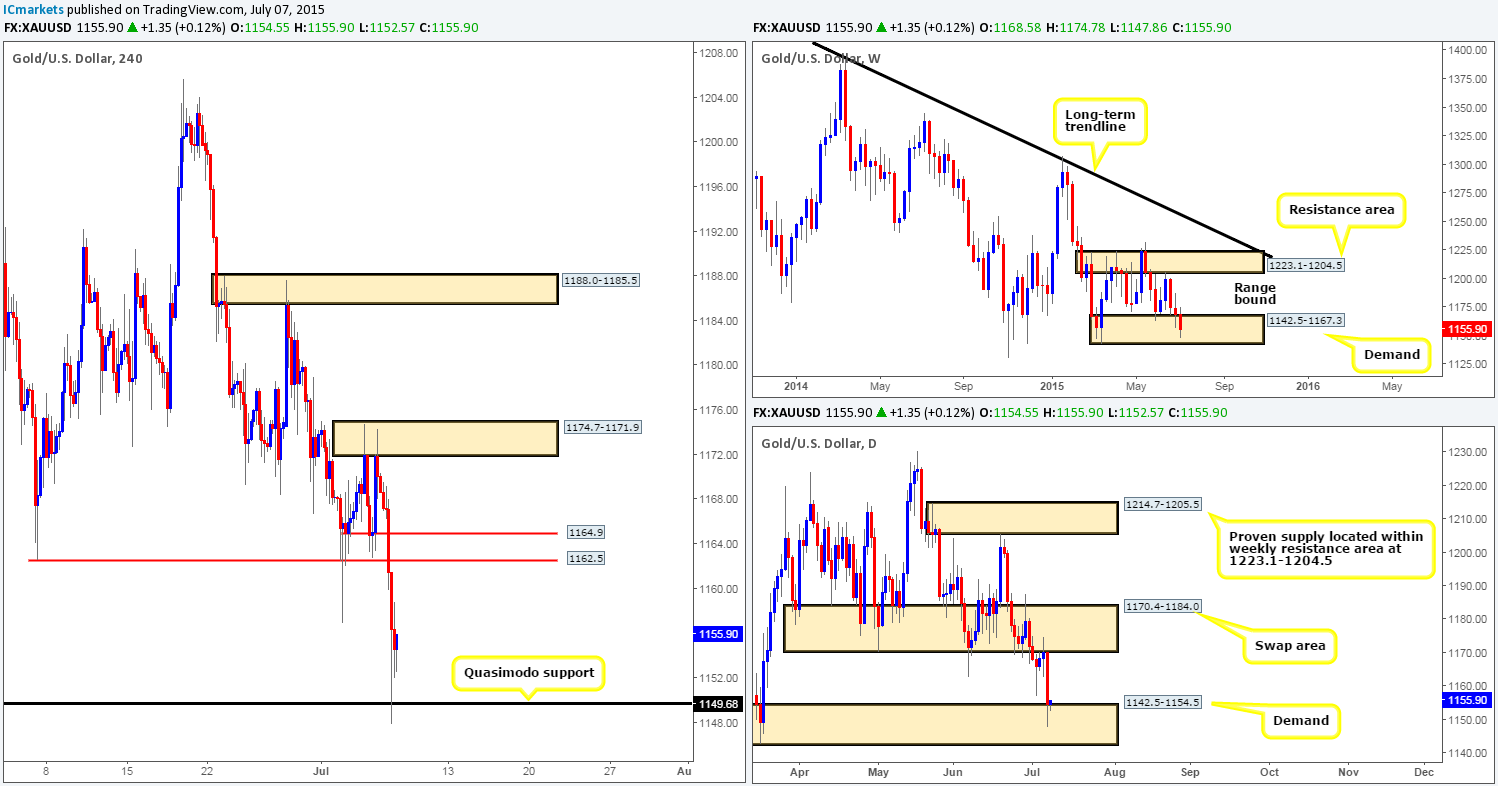
Mid-way through the London session heavy sellers came into the Gold market yesterday, taking out the minor 4hr support level visible at 1164.9 and diving head first into a 4hr Quasimodo support level coming in at 1149.6.Now, for those who read our previous report, you may recall that this is where we said price may head to should a break lower be seen as there was little support in the way to stop this free fall.
With this 4hr Quasimodo barrier sitting not only within weekly demand, but also a daily zone as well (1142.5-1167.3 – 1142.5-1154.5), it is likely that further upside will be seen from here. For anyone that placed a pending buy order at this Quasimodo level, good job! For us, however, we opted to wait for lower timeframe confirmation. Ultimately, we would like to see the 15 minute timeframe supply area at 1159.2-1157.0 get taken out – that way; we could begin looking to buy any dips that form knowing that price is pretty much resistance free back up to the 1162.5/1164.9 region on the 4hr timeframe.
Levels to watch/ live orders:
- Buys: 1149.6 [Tentative – confirmation required] (Stop loss: dependent on where one confirms this level).
- Sells: Flat (Stop loss: N/A).

